| Red | Green | Blue | |
| z | 17.64 | ||
| znorm | Inf | ||
| sky | -Inf | -Inf | -Inf |
| S/N | 33.1 | 56.9 | 60.6 |
| S/N(c) | 0.0 | 0.0 | 0.0 |
| SN(E/C) |
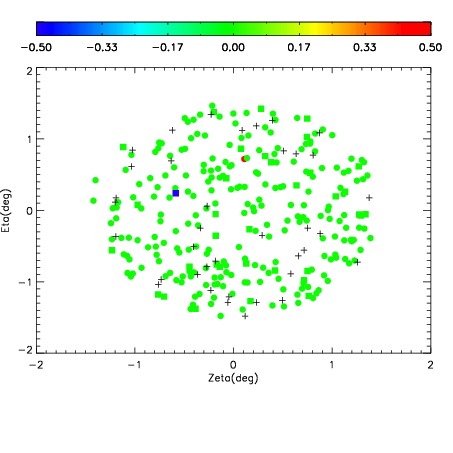
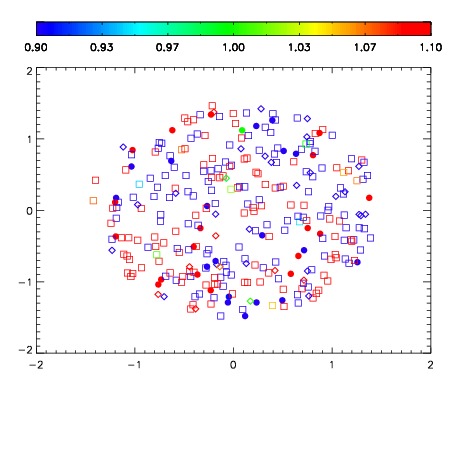
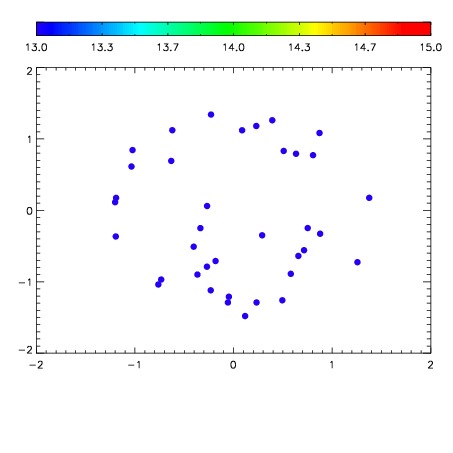

| Frame | Nreads | Zeropoints | Mag plots | Spatial mag deviation | Spatial sky 16325A emission deviations (filled: sky, open: star) | Spatial sky continuum emission | Spatial sky telluric CO2 absorption deviations (filled: H < 10) | |||||||||||||||||||||||
| 0 | 0 |
|
|
|
|
|
|
| IPAIR | NAME | SHIFT | NEWSHIFT | S/N | NAME | SHIFT | NEWSHIFT | S/N |
| 0 | 10230104 | 0.500237 | 0.00000 | 192.110 | 10230098 | 0.00257376 | 0.497663 | 193.675 |
| 1 | 10230097 | 0.498418 | 0.00181898 | 196.898 | 10230102 | -0.00189461 | 0.502132 | 196.198 |
| 2 | 10230100 | 0.499087 | 0.00114998 | 196.406 | 10230095 | 0.00000 | 0.500237 | 194.765 |
| 3 | 10230096 | 0.498310 | 0.00192699 | 193.672 | 10230099 | 0.00246944 | 0.497768 | 194.530 |
| 4 | 10230101 | 0.500034 | 0.000203013 | 191.793 | 10230103 | -0.00208538 | 0.502322 | 190.737 |