| Red | Green | Blue | |
| z | 17.64 | ||
| znorm | Inf | ||
| sky | -Inf | -NaN | -Inf |
| S/N | 27.5 | 43.4 | 49.5 |
| S/N(c) | 0.0 | 0.0 | 0.0 |
| SN(E/C) |
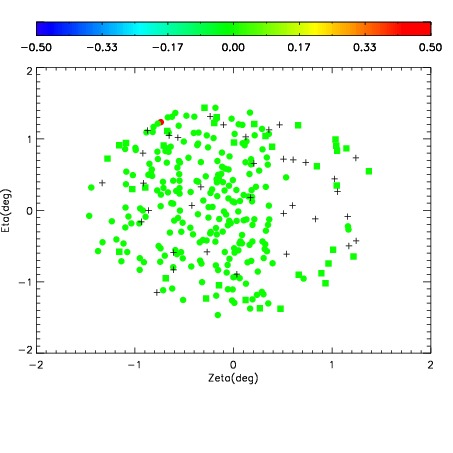
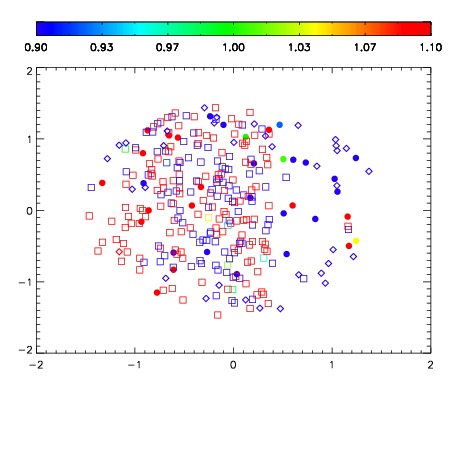
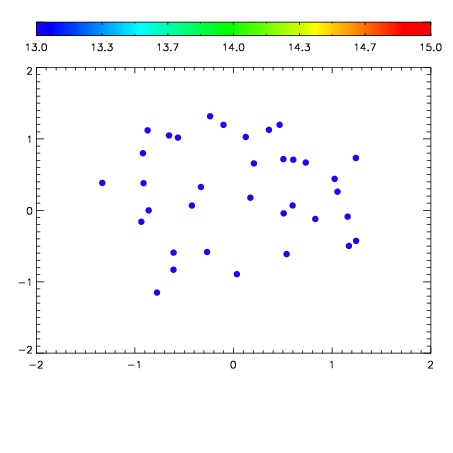

| Frame | Nreads | Zeropoints | Mag plots | Spatial mag deviation | Spatial sky 16325A emission deviations (filled: sky, open: star) | Spatial sky continuum emission | Spatial sky telluric CO2 absorption deviations (filled: H < 10) | |||||||||||||||||||||||
| 0 | 0 |
|
|
|
|
|
|
| IPAIR | NAME | SHIFT | NEWSHIFT | S/N | NAME | SHIFT | NEWSHIFT | S/N |
| 0 | 02850029 | 0.413959 | 0.00000 | 249.667 | 02850030 | 0.000156770 | 0.413802 | 249.650 |
| 1 | 02850024 | 0.409329 | 0.00463000 | 253.160 | 02850026 | -0.000467503 | 0.414427 | 253.230 |
| 2 | 02850025 | 0.410596 | 0.00336298 | 251.454 | 02850027 | -0.00164112 | 0.415600 | 250.366 |
| 3 | 02850028 | 0.412586 | 0.00137299 | 247.378 | 02850023 | 0.00000 | 0.413959 | 249.115 |