| Red | Green | Blue | |
| z | 17.64 | ||
| znorm | Inf | ||
| sky | -Inf | -Inf | -Inf |
| S/N | 25.7 | 45.6 | 49.1 |
| S/N(c) | 0.0 | 0.0 | 0.0 |
| SN(E/C) |
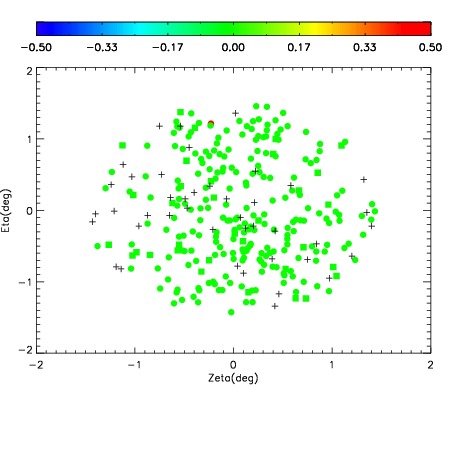
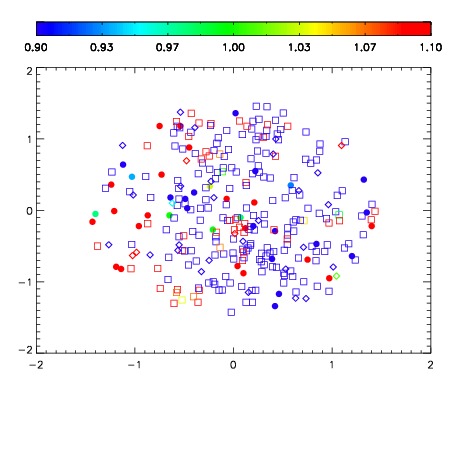
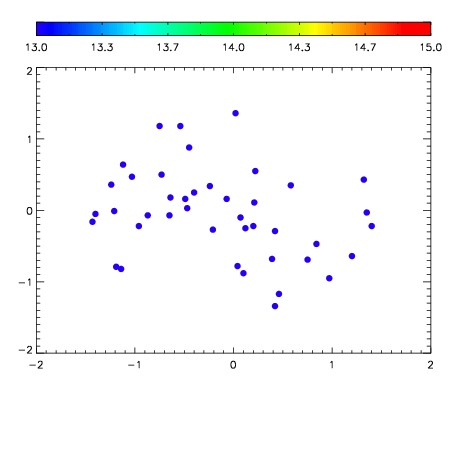

| Frame | Nreads | Zeropoints | Mag plots | Spatial mag deviation | Spatial sky 16325A emission deviations (filled: sky, open: star) | Spatial sky continuum emission | Spatial sky telluric CO2 absorption deviations (filled: H < 10) | |||||||||||||||||||||||
| 0 | 0 |
|
|
|
|
|
|
| IPAIR | NAME | SHIFT | NEWSHIFT | S/N | NAME | SHIFT | NEWSHIFT | S/N |
| 0 | 02880088 | 0.404785 | 0.00000 | 240.659 | 02880086 | -0.000379912 | 0.405165 | 237.352 |
| 1 | 02880087 | 0.404166 | 0.000618994 | 245.341 | 02880089 | 0.00110327 | 0.403682 | 244.217 |
| 2 | 02880083 | 0.403684 | 0.00110102 | 232.087 | 02880085 | 0.000647675 | 0.404137 | 235.469 |
| 3 | 02880084 | 0.403931 | 0.000854015 | 229.225 | 02880082 | 0.00000 | 0.404785 | 227.147 |