| Red | Green | Blue | |
| z | 17.64 | ||
| znorm | Inf | ||
| sky | -Inf | -Inf | -Inf |
| S/N | 24.2 | 43.6 | 44.8 |
| S/N(c) | 0.0 | 0.0 | 0.0 |
| SN(E/C) |
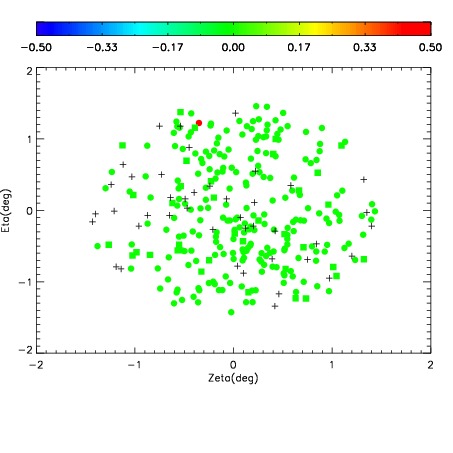
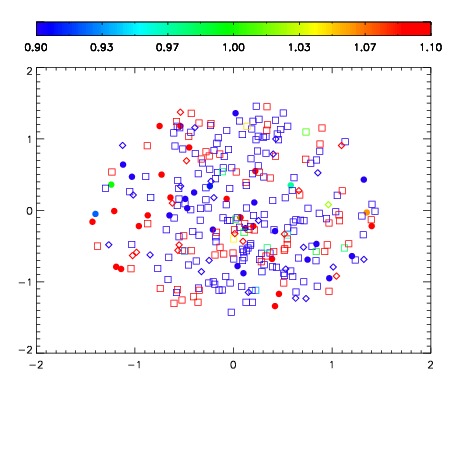
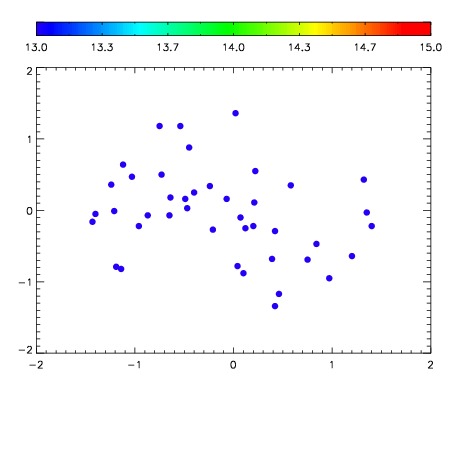

| Frame | Nreads | Zeropoints | Mag plots | Spatial mag deviation | Spatial sky 16325A emission deviations (filled: sky, open: star) | Spatial sky continuum emission | Spatial sky telluric CO2 absorption deviations (filled: H < 10) | |||||||||||||||||||||||
| 0 | 0 |
|
|
|
|
|
|
| IPAIR | NAME | SHIFT | NEWSHIFT | S/N | NAME | SHIFT | NEWSHIFT | S/N |
| 0 | 02920047 | 0.398332 | 0.00000 | 244.024 | 02920045 | 0.00000 | 0.398332 | 234.107 |
| 1 | 02920051 | 0.396852 | 0.00148001 | 254.450 | 02920052 | -0.000390587 | 0.398723 | 251.396 |
| 2 | 02920050 | 0.395719 | 0.00261301 | 253.062 | 02920048 | 0.00164236 | 0.396690 | 248.517 |
| 3 | 02920046 | 0.398122 | 0.000209987 | 246.518 | 02920049 | -0.000591443 | 0.398923 | 247.861 |