| Red | Green | Blue | |
| z | 17.64 | ||
| znorm | Inf | ||
| sky | -Inf | -Inf | -Inf |
| S/N | 24.4 | 43.6 | 47.4 |
| S/N(c) | 0.0 | 0.0 | 0.0 |
| SN(E/C) |
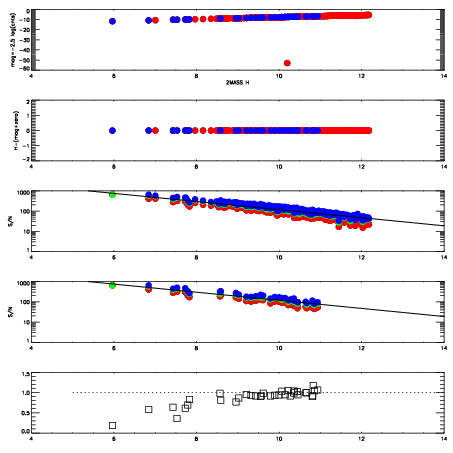
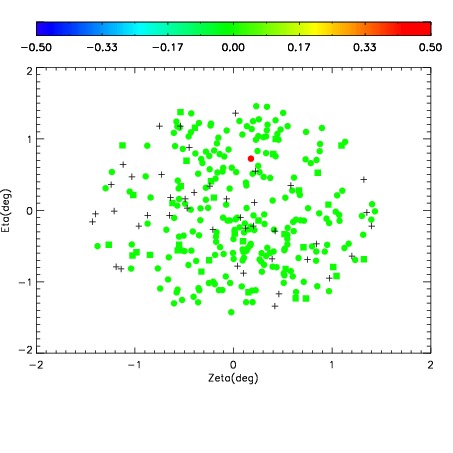

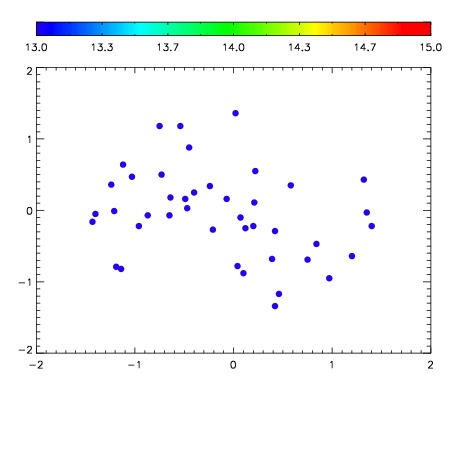

| Frame | Nreads | Zeropoints | Mag plots | Spatial mag deviation | Spatial sky 16325A emission deviations (filled: sky, open: star) | Spatial sky continuum emission | Spatial sky telluric CO2 absorption deviations (filled: H < 10) | |||||||||||||||||||||||
| 0 | 0 |
|
|
|
|
|
|
| IPAIR | NAME | SHIFT | NEWSHIFT | S/N | NAME | SHIFT | NEWSHIFT | S/N |
| 0 | 03190051 | 0.497874 | 0.00000 | 236.137 | 03190049 | -0.000610610 | 0.498485 | 233.111 |
| 1 | 03190050 | 0.495217 | 0.00265700 | 233.446 | 03190052 | 0.00212567 | 0.495748 | 232.820 |
| 2 | 03190047 | 0.496471 | 0.00140300 | 222.867 | 03190048 | -0.000218307 | 0.498092 | 230.619 |
| 3 | 03190046 | 0.495977 | 0.00189698 | 203.966 | 03190045 | 0.00000 | 0.497874 | 198.832 |