| Red | Green | Blue | |
| z | 17.64 | ||
| znorm | Inf | ||
| sky | -Inf | -Inf | -Inf |
| S/N | 26.9 | 44.4 | 51.3 |
| S/N(c) | 0.0 | 0.0 | 0.0 |
| SN(E/C) |
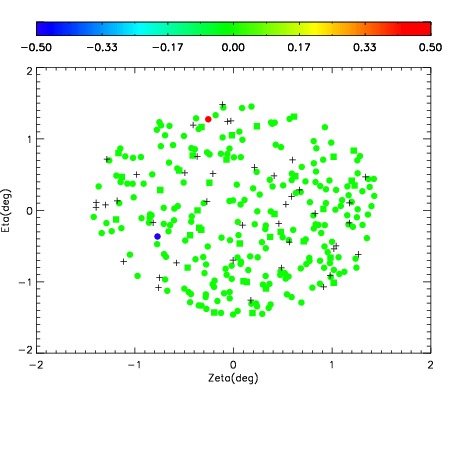
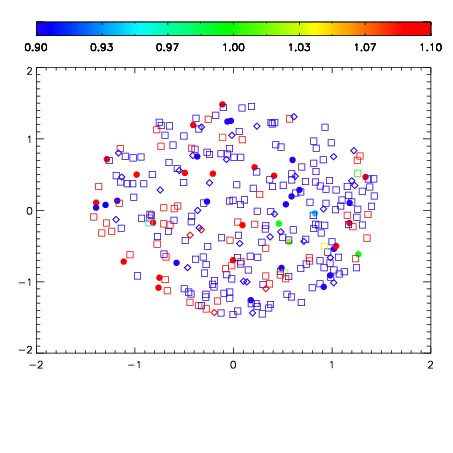
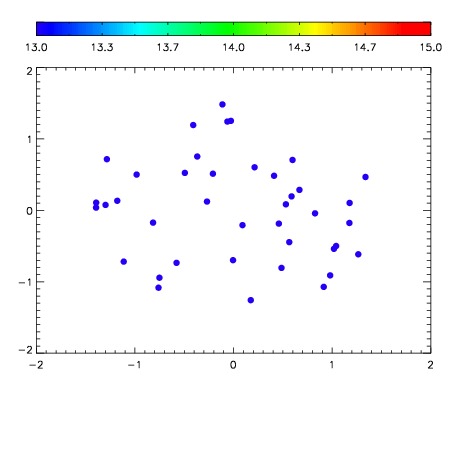

| Frame | Nreads | Zeropoints | Mag plots | Spatial mag deviation | Spatial sky 16325A emission deviations (filled: sky, open: star) | Spatial sky continuum emission | Spatial sky telluric CO2 absorption deviations (filled: H < 10) | |||||||||||||||||||||||
| 0 | 0 |
|
|
|
|
|
|
| IPAIR | NAME | SHIFT | NEWSHIFT | S/N | NAME | SHIFT | NEWSHIFT | S/N |
| 0 | 12720061 | 0.484343 | 0.00000 | 227.191 | 12720067 | -0.00287465 | 0.487218 | 225.355 |
| 1 | 12720065 | 0.480109 | 0.00423399 | 230.236 | 12720064 | -0.00349537 | 0.487838 | 231.896 |
| 2 | 12720062 | 0.484142 | 0.000200987 | 228.367 | 12720063 | -0.00308196 | 0.487425 | 230.428 |
| 3 | 12720066 | 0.481494 | 0.00284898 | 224.132 | 12720060 | 0.00000 | 0.484343 | 220.633 |