| Red | Green | Blue | |
| z | 17.64 | ||
| znorm | Inf | ||
| sky | -Inf | -Inf | -Inf |
| S/N | 26.8 | 46.6 | 50.6 |
| S/N(c) | 0.0 | 0.0 | 0.0 |
| SN(E/C) |

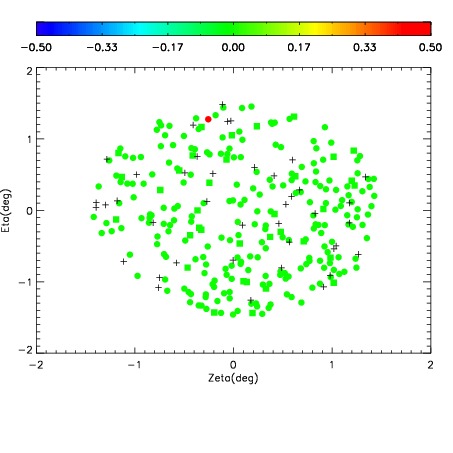
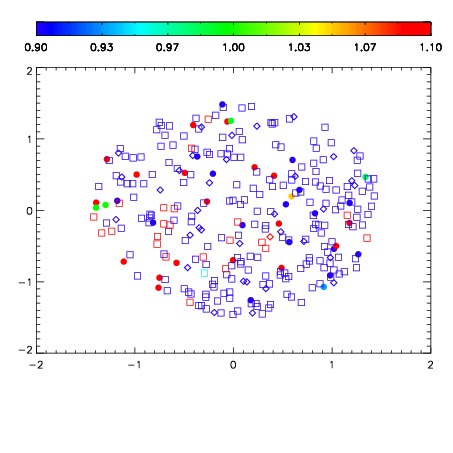
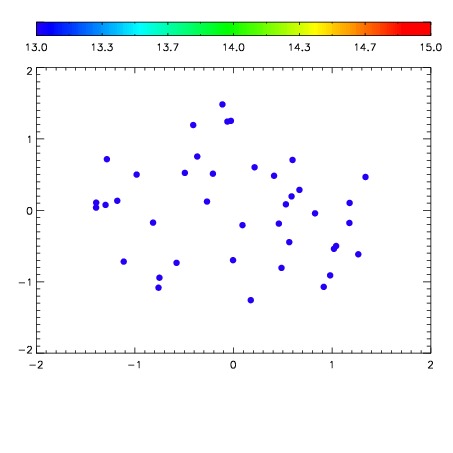

| Frame | Nreads | Zeropoints | Mag plots | Spatial mag deviation | Spatial sky 16325A emission deviations (filled: sky, open: star) | Spatial sky continuum emission | Spatial sky telluric CO2 absorption deviations (filled: H < 10) | |||||||||||||||||||||||
| 0 | 0 |
|
|
|
|
|
|
| IPAIR | NAME | SHIFT | NEWSHIFT | S/N | NAME | SHIFT | NEWSHIFT | S/N |
| 0 | 12740059 | 0.453934 | 0.00000 | 229.952 | 12740061 | -0.00503160 | 0.458966 | 235.091 |
| 1 | 12740063 | 0.448731 | 0.00520301 | 241.333 | 12740062 | -0.00476420 | 0.458698 | 240.188 |
| 2 | 12740064 | 0.449493 | 0.00444102 | 238.873 | 12740065 | -0.00412722 | 0.458061 | 235.153 |
| 3 | 12740060 | 0.453109 | 0.000825018 | 228.605 | 12740058 | 0.00000 | 0.453934 | 230.421 |