| Red | Green | Blue | |
| z | 17.64 | ||
| znorm | Inf | ||
| sky | -Inf | -Inf | -Inf |
| S/N | 26.3 | 44.5 | 50.7 |
| S/N(c) | 0.0 | 0.0 | 0.0 |
| SN(E/C) |
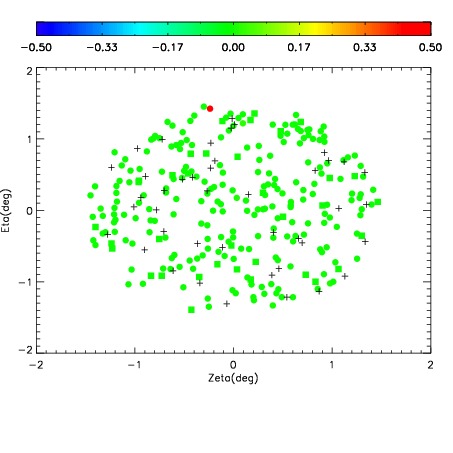
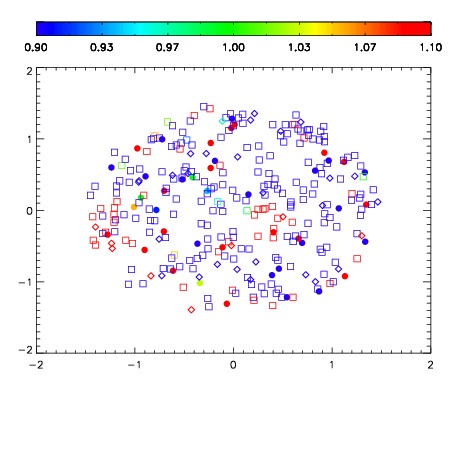
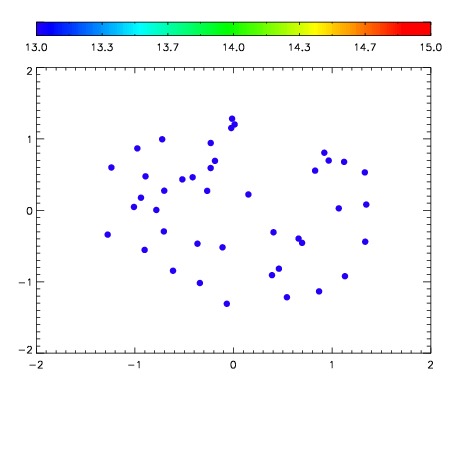

| Frame | Nreads | Zeropoints | Mag plots | Spatial mag deviation | Spatial sky 16325A emission deviations (filled: sky, open: star) | Spatial sky continuum emission | Spatial sky telluric CO2 absorption deviations (filled: H < 10) | |||||||||||||||||||||||
| 0 | 0 |
|
|
|
|
|
|
| IPAIR | NAME | SHIFT | NEWSHIFT | S/N | NAME | SHIFT | NEWSHIFT | S/N |
| 0 | 09040046 | 0.480589 | 0.00000 | 236.567 | 09040047 | 0.00238206 | 0.478207 | 238.346 |
| 1 | 09040049 | 0.479970 | 0.000618994 | 227.625 | 09040048 | 0.00251651 | 0.478072 | 237.591 |
| 2 | 09040045 | 0.480369 | 0.000220001 | 227.441 | 09040051 | 0.000619717 | 0.479969 | 224.513 |
| 3 | 09040050 | 0.480264 | 0.000324994 | 221.868 | 09040044 | 0.00000 | 0.480589 | 211.430 |