| Red | Green | Blue | |
| z | 17.64 | ||
| znorm | Inf | ||
| sky | -Inf | -Inf | -Inf |
| S/N | 25.1 | 43.5 | 47.6 |
| S/N(c) | 0.0 | 0.0 | 0.0 |
| SN(E/C) |
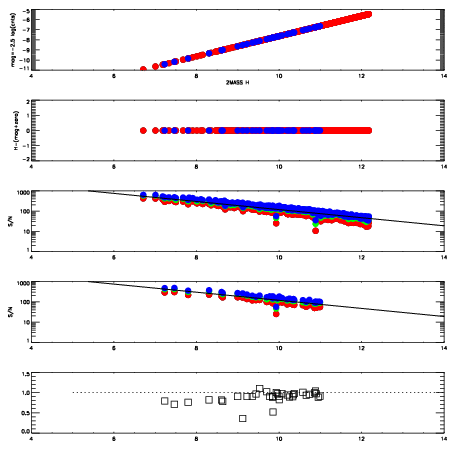
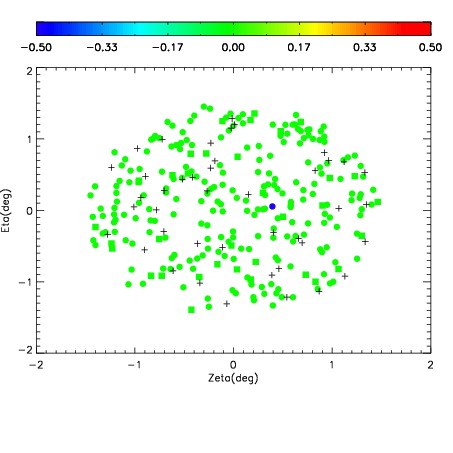
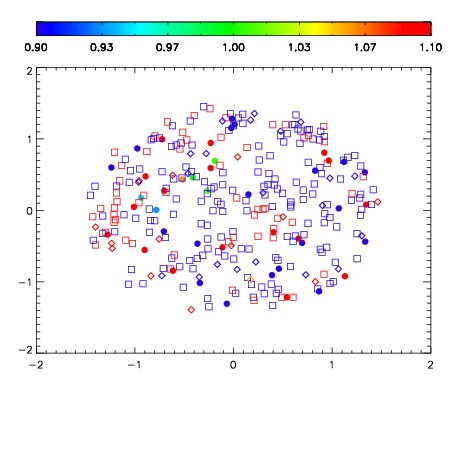
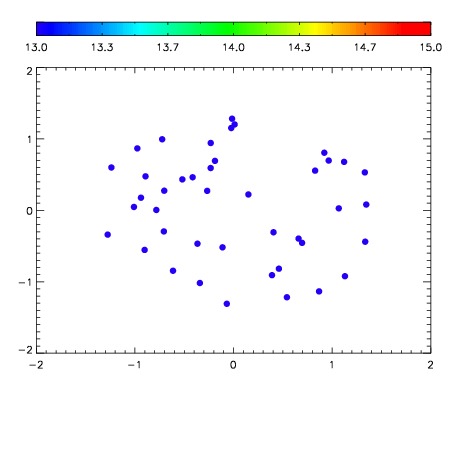

| Frame | Nreads | Zeropoints | Mag plots | Spatial mag deviation | Spatial sky 16325A emission deviations (filled: sky, open: star) | Spatial sky continuum emission | Spatial sky telluric CO2 absorption deviations (filled: H < 10) | |||||||||||||||||||||||
| 0 | 0 |
|
|
|
|
|
|
| IPAIR | NAME | SHIFT | NEWSHIFT | S/N | NAME | SHIFT | NEWSHIFT | S/N |
| 0 | 09810028 | 0.522273 | 0.00000 | 210.903 | 09810029 | 0.00473121 | 0.517542 | 214.175 |
| 1 | 09810027 | 0.521822 | 0.000451028 | 202.203 | 09810025 | 0.00442000 | 0.517853 | 209.119 |
| 2 | 09810023 | 0.520899 | 0.00137401 | 201.108 | 09810022 | 0.00000 | 0.522273 | 203.866 |
| 3 | 09810024 | 0.521547 | 0.000725985 | 200.786 | 09810026 | 0.00435407 | 0.517919 | 198.376 |