| Red | Green | Blue | |
| z | 17.64 | ||
| znorm | Inf | ||
| sky | -Inf | -Inf | -Inf |
| S/N | 24.8 | 41.4 | 47.9 |
| S/N(c) | 0.0 | 0.0 | 0.0 |
| SN(E/C) |
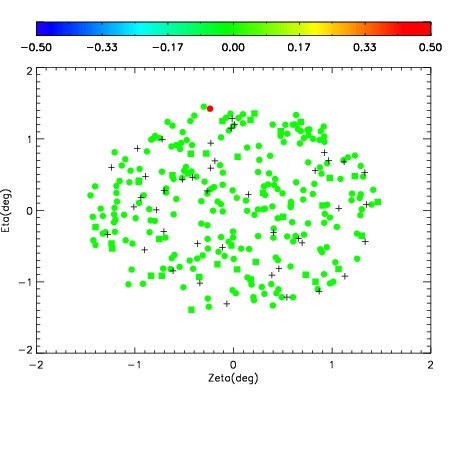
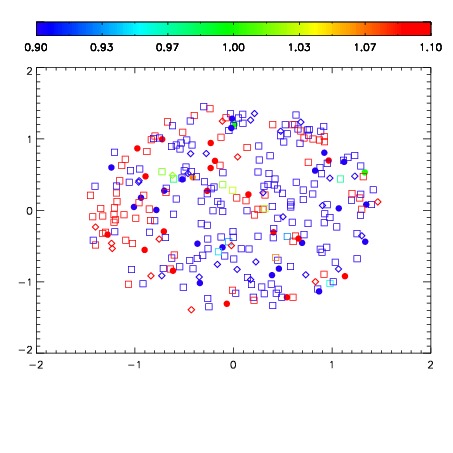
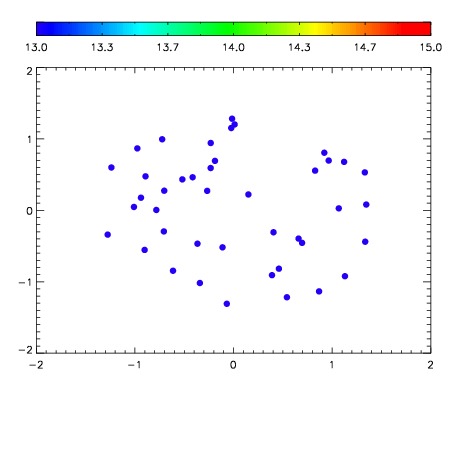

| Frame | Nreads | Zeropoints | Mag plots | Spatial mag deviation | Spatial sky 16325A emission deviations (filled: sky, open: star) | Spatial sky continuum emission | Spatial sky telluric CO2 absorption deviations (filled: H < 10) | |||||||||||||||||||||||
| 0 | 0 |
|
|
|
|
|
|
| IPAIR | NAME | SHIFT | NEWSHIFT | S/N | NAME | SHIFT | NEWSHIFT | S/N |
| 0 | 10000015 | 0.468440 | 0.00000 | 156.700 | 10000014 | 0.00350076 | 0.464939 | 118.438 |
| 1 | 10000016 | 0.466860 | 0.00158000 | 242.404 | 10000017 | 0.00530196 | 0.463138 | 245.981 |
| 2 | 10000012 | 0.467187 | 0.00125301 | 239.578 | 10000010 | 0.00000 | 0.468440 | 237.670 |
| 3 | 10000011 | 0.466916 | 0.00152400 | 239.153 | 10000013 | 0.00269881 | 0.465741 | 216.644 |