| Red | Green | Blue | |
| z | 17.64 | ||
| znorm | Inf | ||
| sky | -Inf | -NaN | -Inf |
| S/N | 26.7 | 45.5 | 51.7 |
| S/N(c) | 0.0 | 0.0 | 0.0 |
| SN(E/C) |
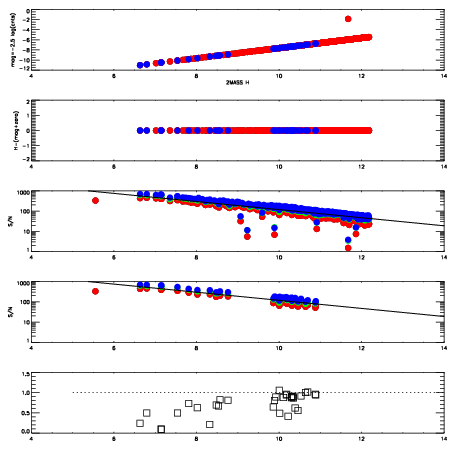
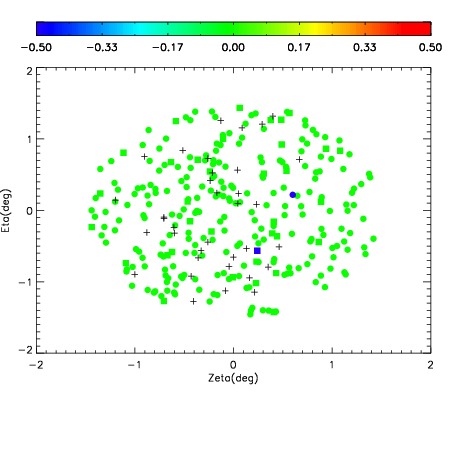

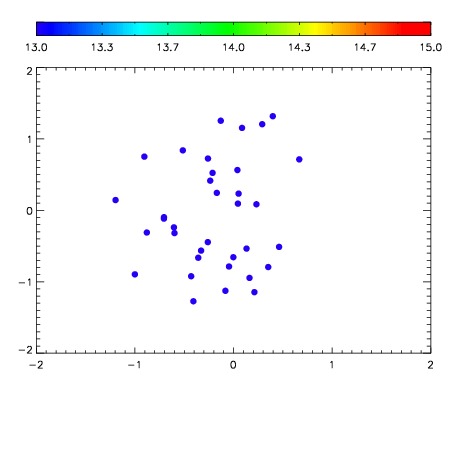

| Frame | Nreads | Zeropoints | Mag plots | Spatial mag deviation | Spatial sky 16325A emission deviations (filled: sky, open: star) | Spatial sky continuum emission | Spatial sky telluric CO2 absorption deviations (filled: H < 10) | |||||||||||||||||||||||
| 0 | 0 |
|
|
|
|
|
|
| IPAIR | NAME | SHIFT | NEWSHIFT | S/N | NAME | SHIFT | NEWSHIFT | S/N |
| 0 | 10160030 | 0.504871 | 0.00000 | 258.372 | 10160031 | 0.00424900 | 0.500622 | 255.896 |
| 1 | 10160029 | 0.503719 | 0.00115204 | 256.522 | 10160032 | 0.00371189 | 0.501159 | 254.619 |
| 2 | 10160033 | 0.503570 | 0.00130099 | 248.628 | 10160028 | 0.00000 | 0.504871 | 251.894 |
| 3 | 10160034 | 0.503985 | 0.000886023 | 247.045 | 10160035 | 0.00491716 | 0.499954 | 243.406 |