| Red | Green | Blue | |
| z | 17.64 | ||
| znorm | Inf | ||
| sky | -Inf | -Inf | -Inf |
| S/N | 28.0 | 46.0 | 51.3 |
| S/N(c) | 0.0 | 0.0 | 0.0 |
| SN(E/C) |
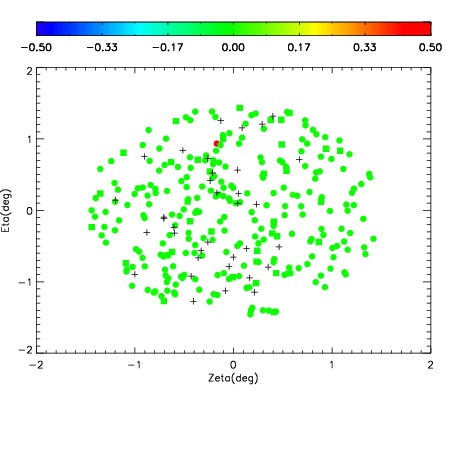
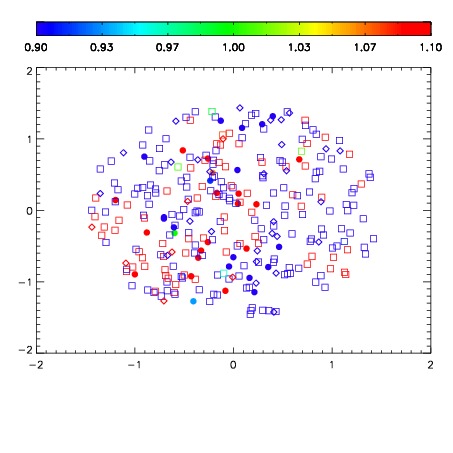
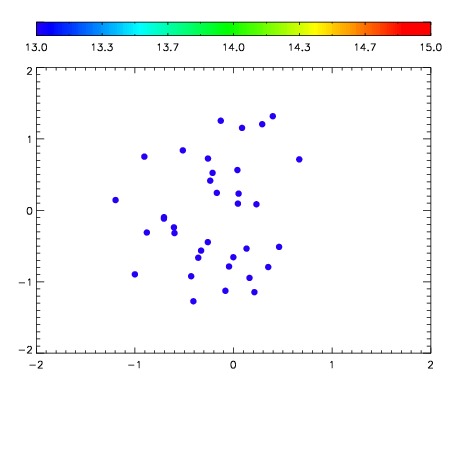

| Frame | Nreads | Zeropoints | Mag plots | Spatial mag deviation | Spatial sky 16325A emission deviations (filled: sky, open: star) | Spatial sky continuum emission | Spatial sky telluric CO2 absorption deviations (filled: H < 10) | |||||||||||||||||||||||
| 0 | 0 |
|
|
|
|
|
|
| IPAIR | NAME | SHIFT | NEWSHIFT | S/N | NAME | SHIFT | NEWSHIFT | S/N |
| 0 | 10210031 | 0.493850 | 0.00000 | 267.681 | 10210026 | 0.00000 | 0.493850 | 268.641 |
| 1 | 10210027 | 0.493469 | 0.000380993 | 265.500 | 10210030 | 0.000792299 | 0.493058 | 265.909 |
| 2 | 10210032 | 0.493219 | 0.000631005 | 264.566 | 10210029 | 0.000965036 | 0.492885 | 263.646 |
| 3 | 10210028 | 0.493522 | 0.000328004 | 261.766 | 10210033 | -3.65063e-05 | 0.493887 | 263.271 |