| Red | Green | Blue | |
| z | 17.64 | ||
| znorm | Inf | ||
| sky | -Inf | -NaN | -Inf |
| S/N | 26.8 | 45.1 | 49.4 |
| S/N(c) | 0.0 | 0.0 | 0.0 |
| SN(E/C) |
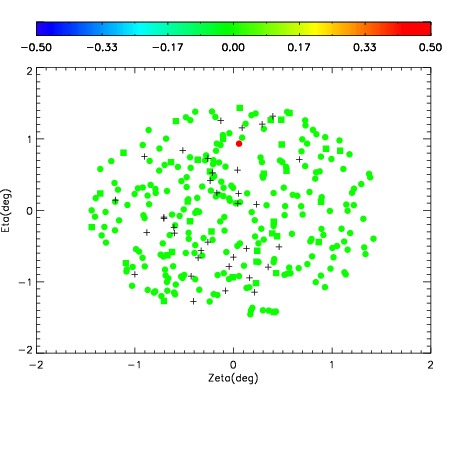
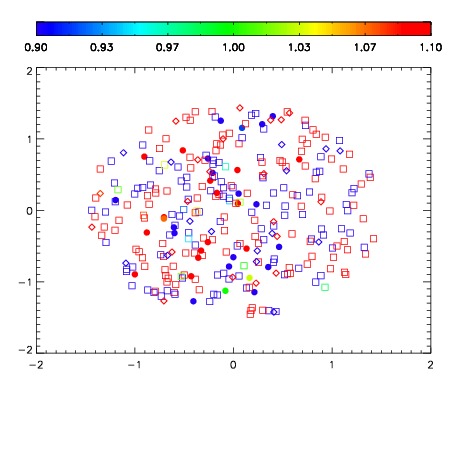
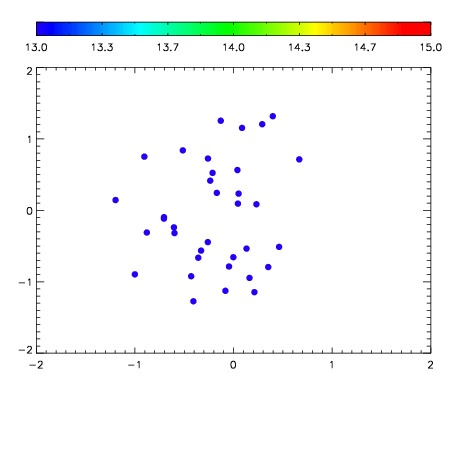

| Frame | Nreads | Zeropoints | Mag plots | Spatial mag deviation | Spatial sky 16325A emission deviations (filled: sky, open: star) | Spatial sky continuum emission | Spatial sky telluric CO2 absorption deviations (filled: H < 10) | |||||||||||||||||||||||
| 0 | 0 |
|
|
|
|
|
|
| IPAIR | NAME | SHIFT | NEWSHIFT | S/N | NAME | SHIFT | NEWSHIFT | S/N |
| 0 | 10430012 | 0.510608 | 0.00000 | 235.654 | 10430014 | 0.00158951 | 0.509018 | 235.283 |
| 1 | 10430016 | 0.508511 | 0.00209701 | 241.907 | 10430015 | 0.00124081 | 0.509367 | 242.653 |
| 2 | 10430017 | 0.508764 | 0.00184399 | 235.514 | 10430018 | 0.0127048 | 0.497903 | 234.742 |
| 3 | 10430013 | 0.510601 | 7.03335e-06 | 226.952 | 10430011 | 0.00000 | 0.510608 | 234.679 |