| Red | Green | Blue | |
| z | 17.64 | ||
| znorm | Inf | ||
| sky | -Inf | -Inf | -Inf |
| S/N | 28.8 | 47.9 | 53.1 |
| S/N(c) | 0.0 | 0.0 | 0.0 |
| SN(E/C) |
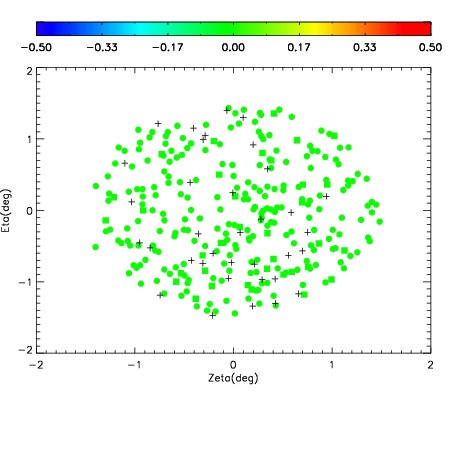
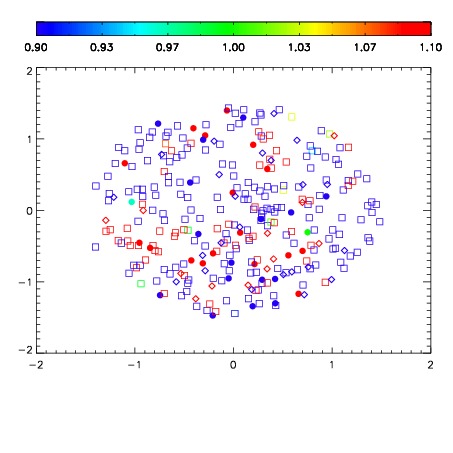


| Frame | Nreads | Zeropoints | Mag plots | Spatial mag deviation | Spatial sky 16325A emission deviations (filled: sky, open: star) | Spatial sky continuum emission | Spatial sky telluric CO2 absorption deviations (filled: H < 10) | |||||||||||||||||||||||
| 0 | 0 |
|
|
|
|
|
|
| IPAIR | NAME | SHIFT | NEWSHIFT | S/N | NAME | SHIFT | NEWSHIFT | S/N |
| 0 | 03120027 | 0.486990 | 0.00000 | 220.966 | 03120028 | -0.00151196 | 0.488502 | 221.814 |
| 1 | 03120030 | 0.486210 | 0.000780016 | 225.682 | 03120029 | 4.41802e-05 | 0.486946 | 223.775 |
| 2 | 03120031 | 0.486631 | 0.000358999 | 220.076 | 03120032 | -0.00257125 | 0.489561 | 217.989 |
| 3 | 03120026 | 0.485889 | 0.00110102 | 218.831 | 03120025 | 0.00000 | 0.486990 | 212.322 |