| Red | Green | Blue | |
| z | 17.64 | ||
| znorm | Inf | ||
| sky | -NaN | -Inf | -Inf |
| S/N | 30.7 | 51.1 | 56.3 |
| S/N(c) | 0.0 | 0.0 | 0.0 |
| SN(E/C) |
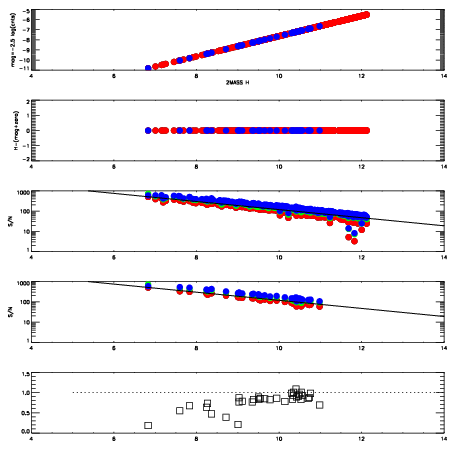
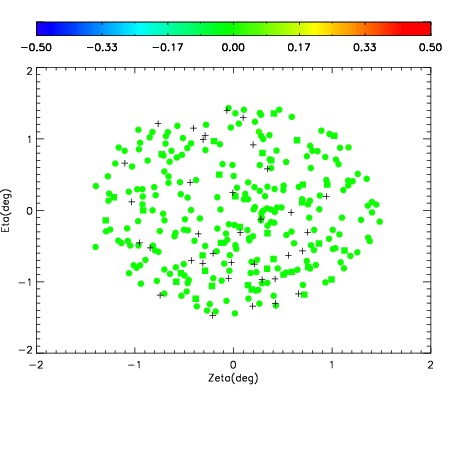
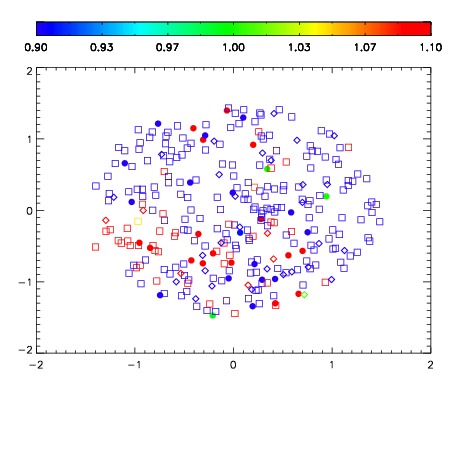
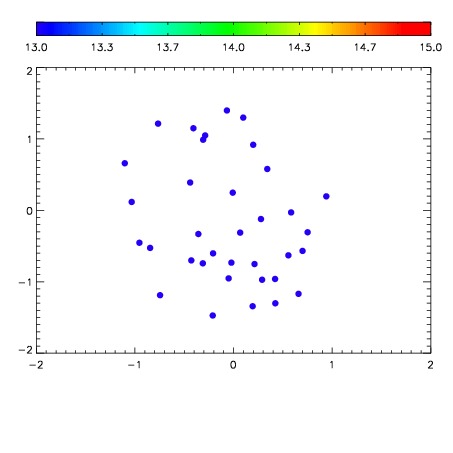

| Frame | Nreads | Zeropoints | Mag plots | Spatial mag deviation | Spatial sky 16325A emission deviations (filled: sky, open: star) | Spatial sky continuum emission | Spatial sky telluric CO2 absorption deviations (filled: H < 10) | |||||||||||||||||||||||
| 0 | 0 |
|
|
|
|
|
|
| IPAIR | NAME | SHIFT | NEWSHIFT | S/N | NAME | SHIFT | NEWSHIFT | S/N |
| 0 | 10430035 | 0.499625 | 0.00000 | 249.625 | 10430037 | 0.00139387 | 0.498231 | 249.973 |
| 1 | 10430039 | 0.498290 | 0.00133500 | 251.763 | 10430036 | 0.00160411 | 0.498021 | 250.993 |
| 2 | 10430034 | 0.499474 | 0.000151008 | 249.385 | 10430033 | 0.00000 | 0.499625 | 248.279 |
| 3 | 10430038 | 0.497847 | 0.00177801 | 249.093 | 10430040 | 0.00295720 | 0.496668 | 247.341 |