| Red | Green | Blue | |
| z | 17.64 | ||
| znorm | Inf | ||
| sky | -Inf | -Inf | -Inf |
| S/N | 20.5 | 37.2 | 41.9 |
| S/N(c) | 0.0 | 0.0 | 0.0 |
| SN(E/C) |
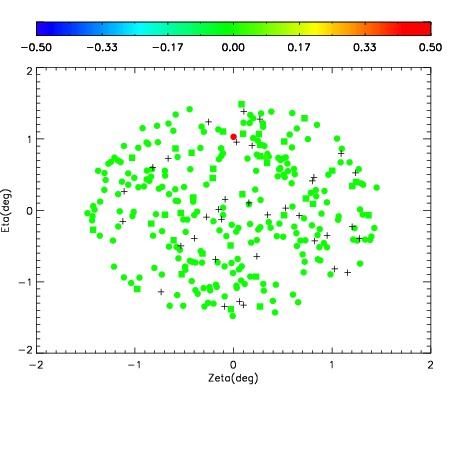
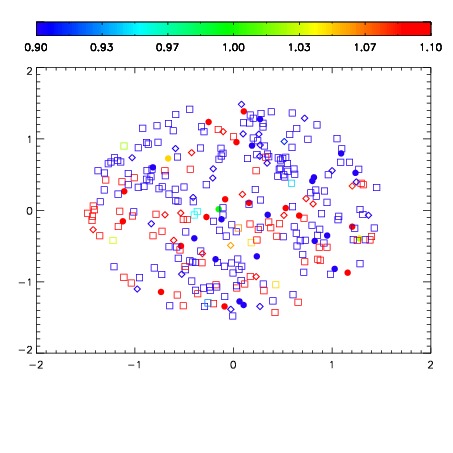
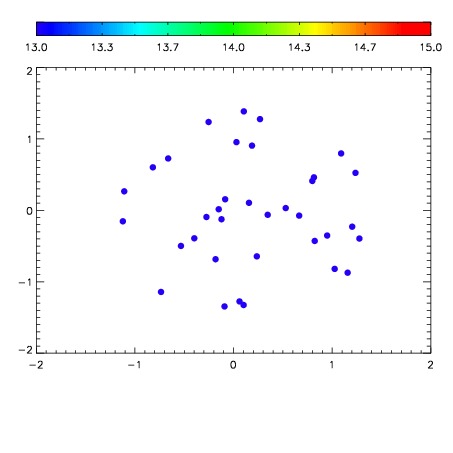

| Frame | Nreads | Zeropoints | Mag plots | Spatial mag deviation | Spatial sky 16325A emission deviations (filled: sky, open: star) | Spatial sky continuum emission | Spatial sky telluric CO2 absorption deviations (filled: H < 10) | |||||||||||||||||||||||
| 0 | 0 |
|
|
|
|
|
|
| IPAIR | NAME | SHIFT | NEWSHIFT | S/N | NAME | SHIFT | NEWSHIFT | S/N |
| 0 | 02810040 | 0.416544 | 0.00000 | 183.320 | 02810041 | 0.000229208 | 0.416315 | 198.326 |
| 1 | 02810044 | 0.415502 | 0.00104198 | 191.796 | 02810045 | -0.000252618 | 0.416797 | 201.170 |
| 2 | 02810043 | 0.411023 | 0.00552100 | 182.822 | 02810038 | 0.00000 | 0.416544 | 197.434 |
| 3 | 02810039 | 0.412620 | 0.00392398 | 178.185 | 02810042 | -0.000794033 | 0.417338 | 189.982 |