| Red | Green | Blue | |
| z | 17.64 | ||
| znorm | Inf | ||
| sky | -Inf | -Inf | -Inf |
| S/N | 23.3 | 41.4 | 47.3 |
| S/N(c) | 0.0 | 0.0 | 0.0 |
| SN(E/C) |

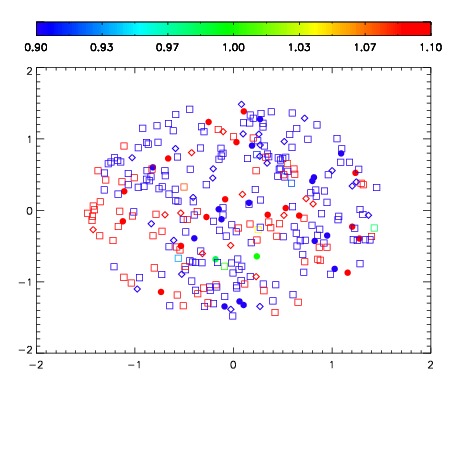
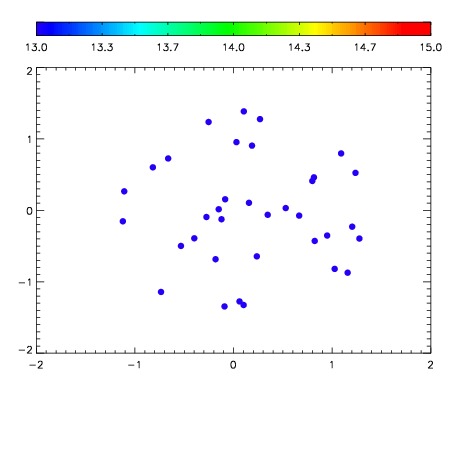

| Frame | Nreads | Zeropoints | Mag plots | Spatial mag deviation | Spatial sky 16325A emission deviations (filled: sky, open: star) | Spatial sky continuum emission | Spatial sky telluric CO2 absorption deviations (filled: H < 10) | |||||||||||||||||||||||
| 0 | 0 |
|
|
|
|
|
|
| IPAIR | NAME | SHIFT | NEWSHIFT | S/N | NAME | SHIFT | NEWSHIFT | S/N |
| 0 | 02820074 | 0.415289 | 0.00000 | 223.749 | 02820072 | 0.000721148 | 0.414568 | 227.042 |
| 1 | 02820073 | 0.411523 | 0.00376600 | 225.897 | 02820075 | 0.000286721 | 0.415002 | 228.800 |
| 2 | 02820070 | 0.413555 | 0.00173402 | 211.978 | 02820071 | 0.00178686 | 0.413502 | 222.191 |
| 3 | 02820069 | 0.409920 | 0.00536901 | 198.185 | 02820068 | 0.00000 | 0.415289 | 185.557 |