| Red | Green | Blue | |
| z | 17.64 | ||
| znorm | Inf | ||
| sky | -Inf | -Inf | -Inf |
| S/N | 23.2 | 42.6 | 46.1 |
| S/N(c) | 0.0 | 0.0 | 0.0 |
| SN(E/C) |
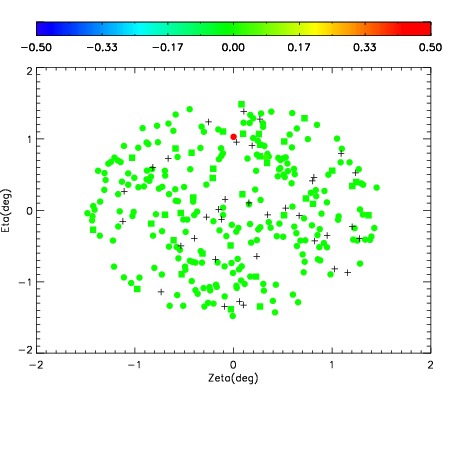

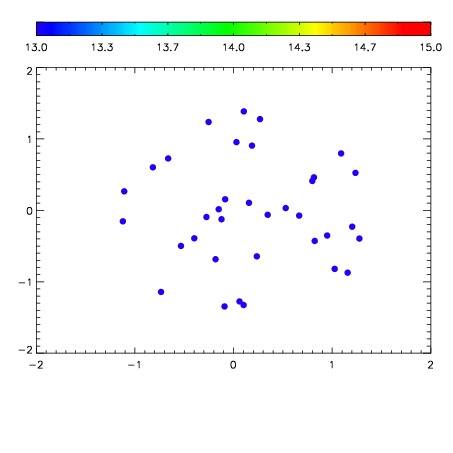

| Frame | Nreads | Zeropoints | Mag plots | Spatial mag deviation | Spatial sky 16325A emission deviations (filled: sky, open: star) | Spatial sky continuum emission | Spatial sky telluric CO2 absorption deviations (filled: H < 10) | |||||||||||||||||||||||
| 0 | 0 |
|
|
|
|
|
|
| IPAIR | NAME | SHIFT | NEWSHIFT | S/N | NAME | SHIFT | NEWSHIFT | S/N |
| 0 | 02830072 | 0.414575 | 0.00000 | 220.842 | 02830073 | 0.00431479 | 0.410260 | 223.210 |
| 1 | 02830075 | 0.411644 | 0.00293100 | 226.354 | 02830074 | 0.000363107 | 0.414212 | 226.269 |
| 2 | 02830076 | 0.411990 | 0.00258502 | 217.950 | 02830070 | 0.00000 | 0.414575 | 218.921 |
| 3 | 02830071 | 0.413719 | 0.000856012 | 211.601 | 02830077 | 0.00299100 | 0.411584 | 210.627 |