| Red | Green | Blue | |
| z | 17.64 | ||
| znorm | Inf | ||
| sky | -Inf | -Inf | -Inf |
| S/N | 25.1 | 44.5 | 48.2 |
| S/N(c) | 0.0 | 0.0 | 0.0 |
| SN(E/C) |
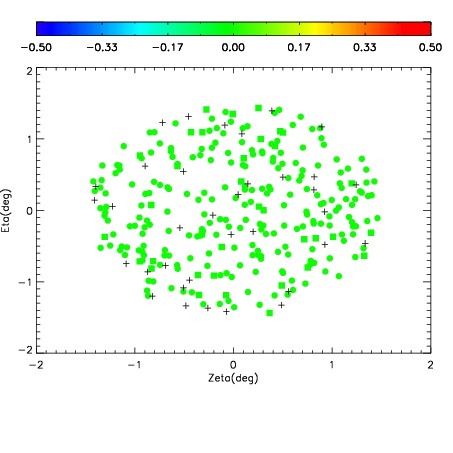
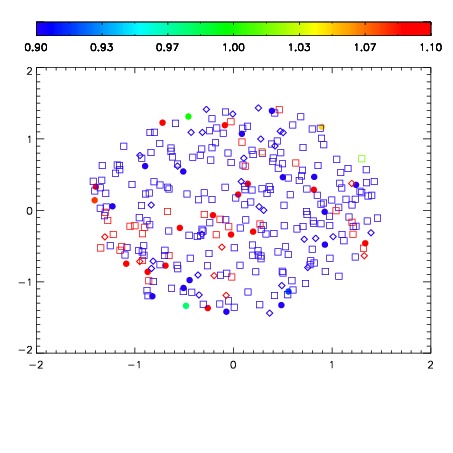
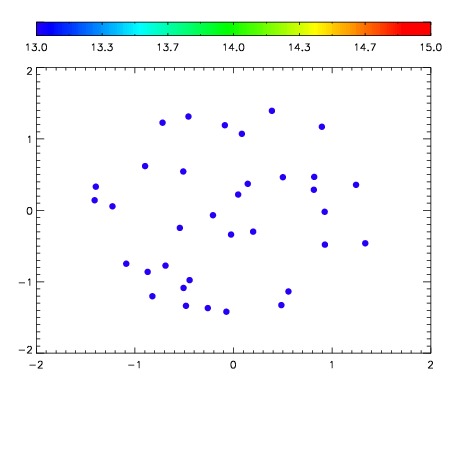

| Frame | Nreads | Zeropoints | Mag plots | Spatial mag deviation | Spatial sky 16325A emission deviations (filled: sky, open: star) | Spatial sky continuum emission | Spatial sky telluric CO2 absorption deviations (filled: H < 10) | |||||||||||||||||||||||
| 0 | 0 |
|
|
|
|
|
|
| IPAIR | NAME | SHIFT | NEWSHIFT | S/N | NAME | SHIFT | NEWSHIFT | S/N |
| 0 | 02890062 | 0.396839 | 0.00000 | 198.087 | 02890063 | 0.00174642 | 0.395093 | 204.908 |
| 1 | 02890061 | 0.395802 | 0.00103700 | 212.561 | 02890060 | 0.00000 | 0.396839 | 212.294 |
| 2 | 02890066 | 0.394696 | 0.00214300 | 210.504 | 02890064 | -0.00351148 | 0.400350 | 209.632 |
| 3 | 02890065 | 0.394242 | 0.00259700 | 210.461 | 02890067 | -0.000402453 | 0.397241 | 207.788 |