| Red | Green | Blue | |
| z | 17.64 | ||
| znorm | Inf | ||
| sky | -Inf | -Inf | -Inf |
| S/N | 18.7 | 35.7 | 38.8 |
| S/N(c) | 0.0 | 0.0 | 0.0 |
| SN(E/C) |
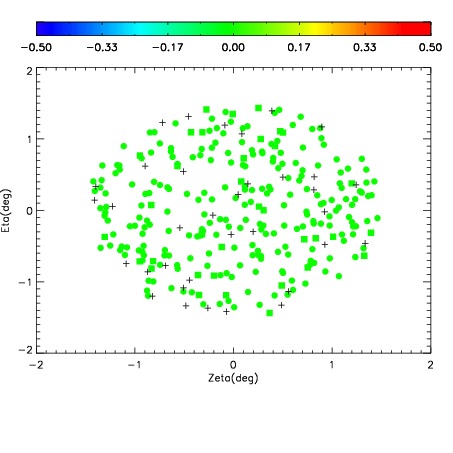
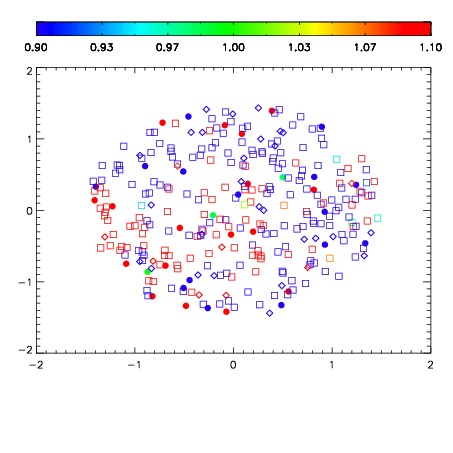


| Frame | Nreads | Zeropoints | Mag plots | Spatial mag deviation | Spatial sky 16325A emission deviations (filled: sky, open: star) | Spatial sky continuum emission | Spatial sky telluric CO2 absorption deviations (filled: H < 10) | |||||||||||||||||||||||
| 0 | 0 |
|
|
|
|
|
|
| IPAIR | NAME | SHIFT | NEWSHIFT | S/N | NAME | SHIFT | NEWSHIFT | S/N |
| 0 | 03070051 | 0.495289 | 0.00000 | 176.490 | 03070052 | -0.00201074 | 0.497300 | 194.609 |
| 1 | 03070047 | 0.493812 | 0.00147700 | 171.336 | 03070045 | 0.00000 | 0.495289 | 185.586 |
| 2 | 03070046 | 0.492461 | 0.00282800 | 170.943 | 03070049 | -0.00374950 | 0.499038 | 141.489 |
| 3 | 03070050 | 0.494735 | 0.000553995 | 158.145 | 03070048 | 8.21604e-05 | 0.495207 | 135.950 |