| Red | Green | Blue | |
| z | 17.64 | ||
| znorm | Inf | ||
| sky | -Inf | -Inf | -Inf |
| S/N | 22.4 | 38.8 | 44.3 |
| S/N(c) | 0.0 | 0.0 | 0.0 |
| SN(E/C) |
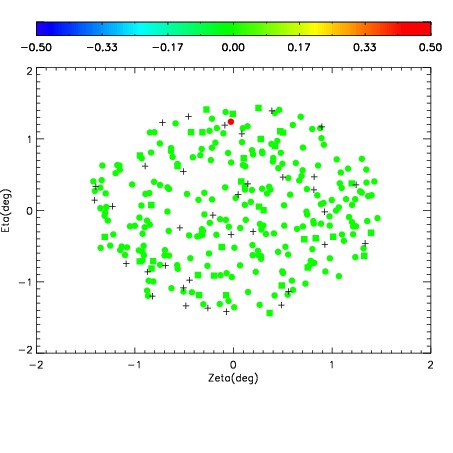
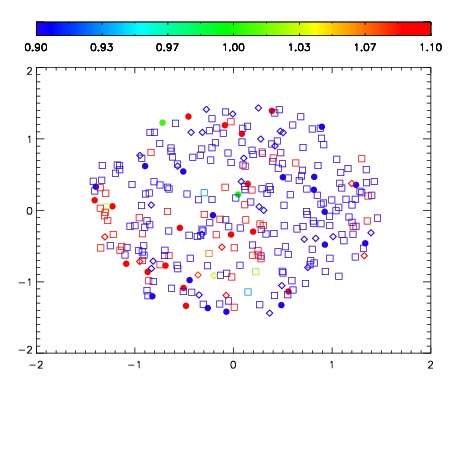
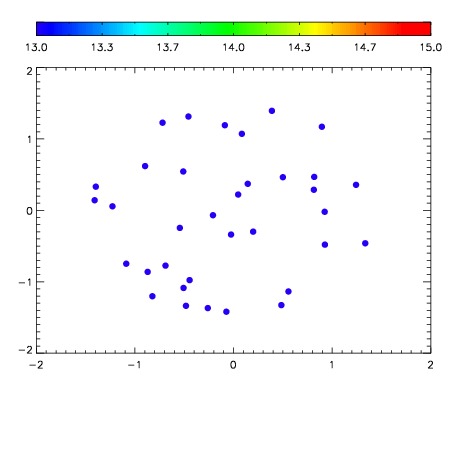

| Frame | Nreads | Zeropoints | Mag plots | Spatial mag deviation | Spatial sky 16325A emission deviations (filled: sky, open: star) | Spatial sky continuum emission | Spatial sky telluric CO2 absorption deviations (filled: H < 10) | |||||||||||||||||||||||
| 0 | 0 |
|
|
|
|
|
|
| IPAIR | NAME | SHIFT | NEWSHIFT | S/N | NAME | SHIFT | NEWSHIFT | S/N |
| 0 | 03100060 | 0.500420 | 0.00000 | 118.083 | 03100058 | 0.00277080 | 0.497649 | 155.203 |
| 1 | 03100055 | 0.495460 | 0.00495997 | 214.342 | 03100054 | 0.00000 | 0.500420 | 215.011 |
| 2 | 03100056 | 0.495553 | 0.00486699 | 212.695 | 03100057 | 0.00547807 | 0.494942 | 199.382 |
| 3 | 03100059 | 0.499794 | 0.000625968 | 121.285 | 03100061 | 0.00753867 | 0.492881 | 159.237 |