| Red | Green | Blue | |
| z | 17.64 | ||
| znorm | Inf | ||
| sky | -Inf | -Inf | -Inf |
| S/N | 26.6 | 44.7 | 53.5 |
| S/N(c) | 0.0 | 0.0 | 0.0 |
| SN(E/C) |
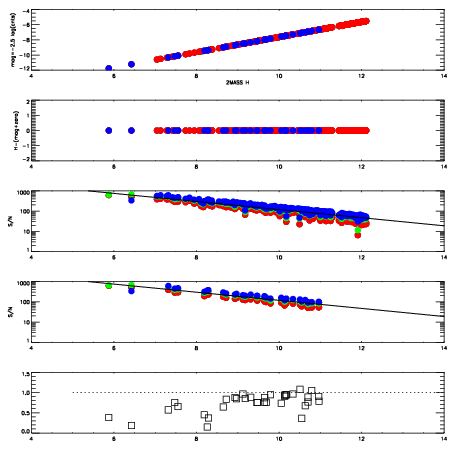
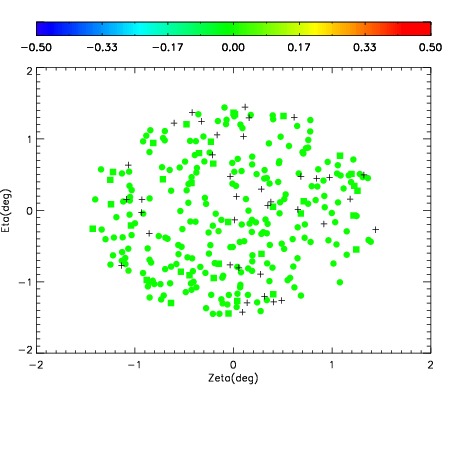
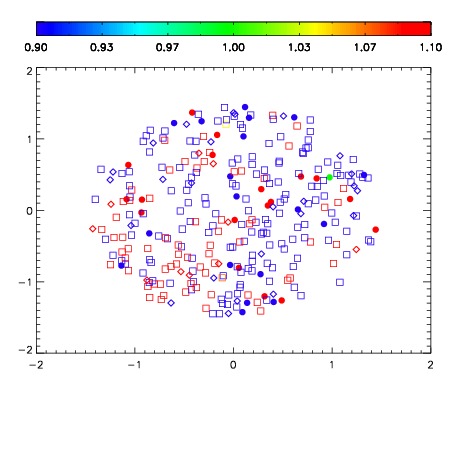


| Frame | Nreads | Zeropoints | Mag plots | Spatial mag deviation | Spatial sky 16325A emission deviations (filled: sky, open: star) | Spatial sky continuum emission | Spatial sky telluric CO2 absorption deviations (filled: H < 10) | |||||||||||||||||||||||
| 0 | 0 |
|
|
|
|
|
|
| IPAIR | NAME | SHIFT | NEWSHIFT | S/N | NAME | SHIFT | NEWSHIFT | S/N |
| 0 | 02880077 | 0.405495 | 0.00000 | 217.049 | 02880071 | 0.00000 | 0.405495 | 200.543 |
| 1 | 02880073 | 0.405135 | 0.000359982 | 222.451 | 02880075 | -0.00132139 | 0.406816 | 222.034 |
| 2 | 02880072 | 0.404629 | 0.000865996 | 220.812 | 02880074 | 0.00124734 | 0.404248 | 216.770 |
| 3 | 02880076 | 0.404830 | 0.000664979 | 220.791 | 02880078 | 0.000453220 | 0.405042 | 215.209 |