| Red | Green | Blue | |
| z | 17.64 | ||
| znorm | Inf | ||
| sky | -Inf | -Inf | -Inf |
| S/N | 24.1 | 41.7 | 45.9 |
| S/N(c) | 0.0 | 0.0 | 0.0 |
| SN(E/C) |
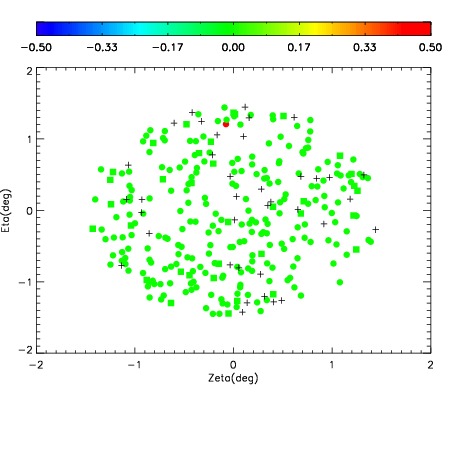
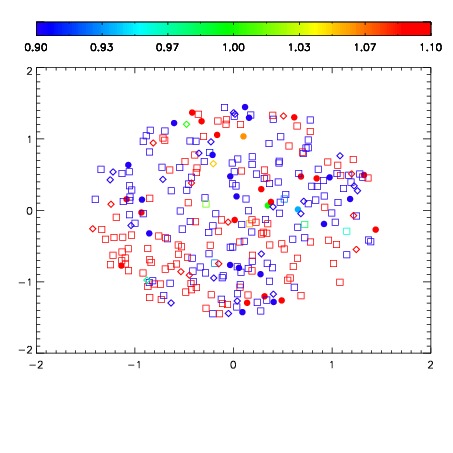
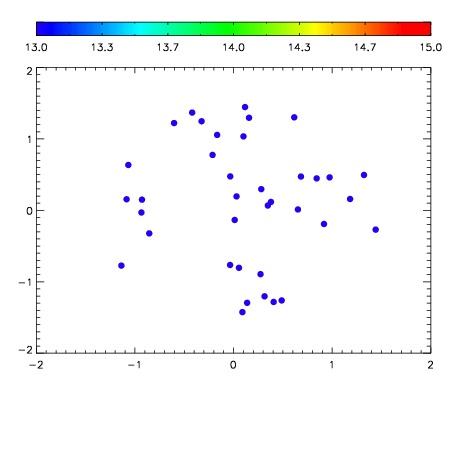

| Frame | Nreads | Zeropoints | Mag plots | Spatial mag deviation | Spatial sky 16325A emission deviations (filled: sky, open: star) | Spatial sky continuum emission | Spatial sky telluric CO2 absorption deviations (filled: H < 10) | |||||||||||||||||||||||
| 0 | 0 |
|
|
|
|
|
|
| IPAIR | NAME | SHIFT | NEWSHIFT | S/N | NAME | SHIFT | NEWSHIFT | S/N |
| 0 | 04050027 | 0.500475 | 0.00000 | 194.259 | 04050029 | -0.000504854 | 0.500980 | 201.736 |
| 1 | 04050031 | 0.497607 | 0.00286800 | 216.338 | 04050032 | 9.95796e-05 | 0.500375 | 213.158 |
| 2 | 04050030 | 0.498165 | 0.00230998 | 214.362 | 04050028 | 0.000584233 | 0.499891 | 211.764 |
| 3 | 04050026 | 0.499817 | 0.000657976 | 199.382 | 04050025 | 0.00000 | 0.500475 | 204.346 |