| Red | Green | Blue | |
| z | 17.64 | ||
| znorm | Inf | ||
| sky | -Inf | -Inf | -Inf |
| S/N | 27.8 | 46.7 | 50.5 |
| S/N(c) | 0.0 | 0.0 | 0.0 |
| SN(E/C) |

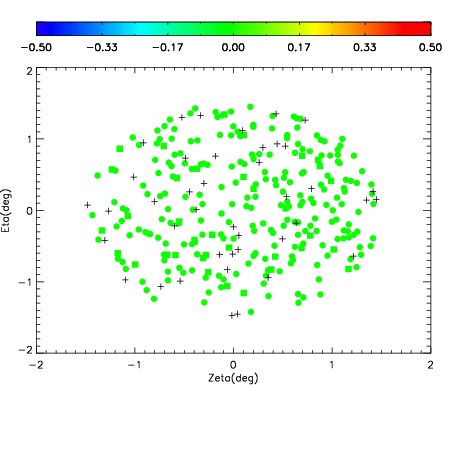


| Frame | Nreads | Zeropoints | Mag plots | Spatial mag deviation | Spatial sky 16325A emission deviations (filled: sky, open: star) | Spatial sky continuum emission | Spatial sky telluric CO2 absorption deviations (filled: H < 10) | |||||||||||||||||||||||
| 0 | 0 |
|
|
|
|
|
|
| IPAIR | NAME | SHIFT | NEWSHIFT | S/N | NAME | SHIFT | NEWSHIFT | S/N |
| 0 | 02850014 | 0.412699 | 0.00000 | 225.825 | 02850016 | -0.000541151 | 0.413240 | 224.236 |
| 1 | 02850018 | 0.411183 | 0.00151601 | 227.811 | 02850019 | -0.000649785 | 0.413349 | 228.035 |
| 2 | 02850017 | 0.409334 | 0.00336501 | 223.351 | 02850015 | 0.00185308 | 0.410846 | 222.849 |
| 3 | 02850013 | 0.411332 | 0.00136700 | 221.807 | 02850012 | 0.00000 | 0.412699 | 222.318 |