| Red | Green | Blue | |
| z | 17.64 | ||
| znorm | Inf | ||
| sky | -NaN | -Inf | -Inf |
| S/N | 17.9 | 33.4 | 36.3 |
| S/N(c) | 0.0 | 0.0 | 0.0 |
| SN(E/C) |
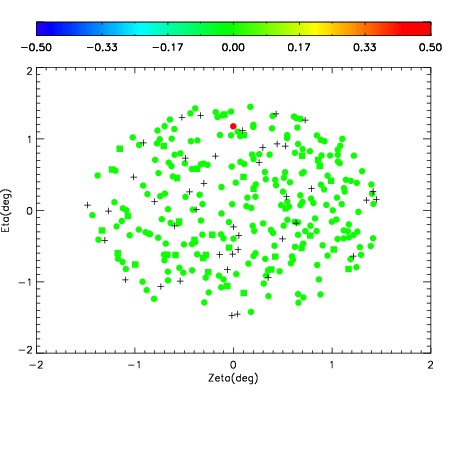
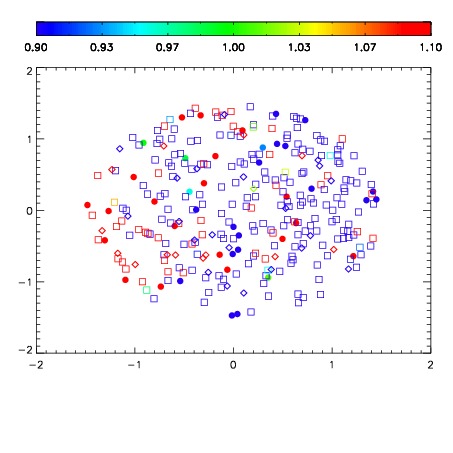


| Frame | Nreads | Zeropoints | Mag plots | Spatial mag deviation | Spatial sky 16325A emission deviations (filled: sky, open: star) | Spatial sky continuum emission | Spatial sky telluric CO2 absorption deviations (filled: H < 10) | |||||||||||||||||||||||
| 0 | 0 |
|
|
|
|
|
|
| IPAIR | NAME | SHIFT | NEWSHIFT | S/N | NAME | SHIFT | NEWSHIFT | S/N |
| 0 | 02900027 | 0.402846 | 0.00000 | 120.999 | 02900028 | 0.000263077 | 0.402583 | 168.304 |
| 1 | 02900031 | 0.400538 | 0.00230801 | 177.946 | 02900032 | 0.000719985 | 0.402126 | 181.773 |
| 2 | 02900030 | 0.399218 | 0.00362802 | 175.922 | 02900029 | -0.000834074 | 0.403680 | 176.949 |
| 3 | 02900026 | 0.401602 | 0.00124401 | 93.9917 | 02900025 | 0.00000 | 0.402846 | 88.7181 |