| Red | Green | Blue | |
| z | 17.64 | ||
| znorm | Inf | ||
| sky | -Inf | -Inf | -Inf |
| S/N | 16.6 | 29.1 | 34.2 |
| S/N(c) | 0.0 | 0.0 | 0.0 |
| SN(E/C) |
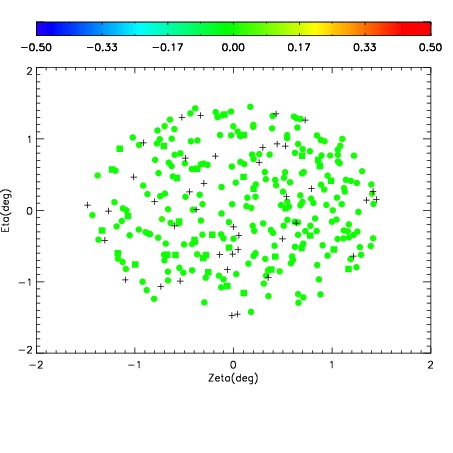
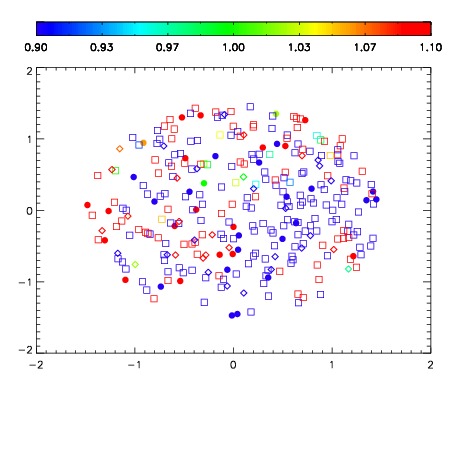
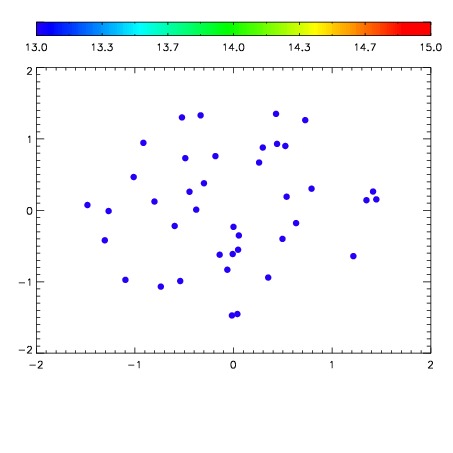

| Frame | Nreads | Zeropoints | Mag plots | Spatial mag deviation | Spatial sky 16325A emission deviations (filled: sky, open: star) | Spatial sky continuum emission | Spatial sky telluric CO2 absorption deviations (filled: H < 10) | |||||||||||||||||||||||
| 0 | 0 |
|
|
|
|
|
|
| IPAIR | NAME | SHIFT | NEWSHIFT | S/N | NAME | SHIFT | NEWSHIFT | S/N |
| 0 | 03990026 | 0.499653 | 0.00000 | 101.827 | 03990027 | 0.00260390 | 0.497049 | 89.0182 |
| 1 | 03990021 | 0.496376 | 0.00327700 | 182.154 | 03990023 | 0.000832533 | 0.498820 | 177.499 |
| 2 | 03990022 | 0.498408 | 0.00124502 | 164.037 | 03990020 | 0.00000 | 0.499653 | 168.451 |
| 3 | 03990025 | 0.497396 | 0.00225702 | 124.988 | 03990024 | 0.000146625 | 0.499506 | 118.560 |