| Red | Green | Blue | |
| z | 17.64 | ||
| znorm | Inf | ||
| sky | -Inf | -Inf | -Inf |
| S/N | 15.5 | 28.7 | 31.4 |
| S/N(c) | 0.0 | 0.0 | 0.0 |
| SN(E/C) |
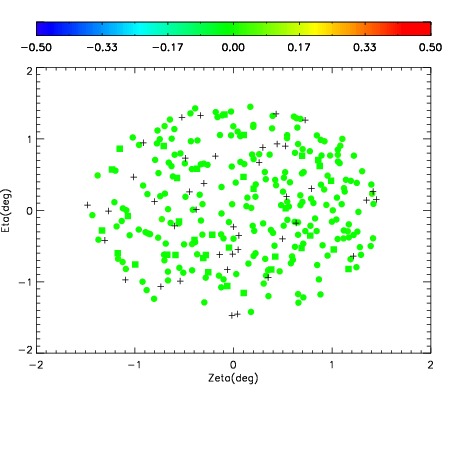

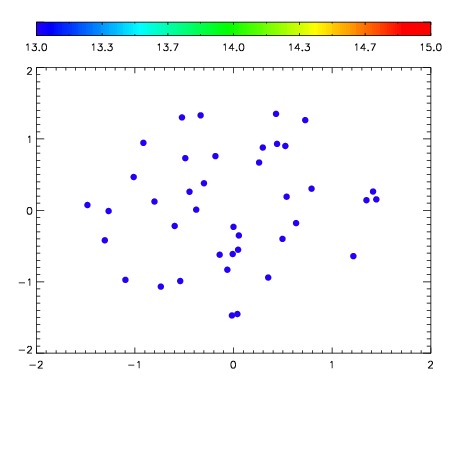

| Frame | Nreads | Zeropoints | Mag plots | Spatial mag deviation | Spatial sky 16325A emission deviations (filled: sky, open: star) | Spatial sky continuum emission | Spatial sky telluric CO2 absorption deviations (filled: H < 10) | |||||||||||||||||||||||
| 0 | 0 |
|
|
|
|
|
|
| IPAIR | NAME | SHIFT | NEWSHIFT | S/N | NAME | SHIFT | NEWSHIFT | S/N |
| 0 | 04010014 | 0.493788 | 0.00000 | 144.521 | 04010015 | 0.00221903 | 0.491569 | 133.737 |
| 1 | 04010009 | 0.491569 | 0.00221899 | 170.896 | 04010008 | 0.00000 | 0.493788 | 203.571 |
| 2 | 04010013 | 0.493413 | 0.000375003 | 140.334 | 04010012 | 0.000182201 | 0.493606 | 132.543 |
| 3 | 04010010 | 0.493499 | 0.000288993 | 106.950 | 04010011 | 0.000439452 | 0.493349 | 96.1787 |