| Red | Green | Blue | |
| z | 17.64 | ||
| znorm | Inf | ||
| sky | -Inf | -NaN | -Inf |
| S/N | 27.2 | 47.1 | 53.9 |
| S/N(c) | 0.0 | 0.0 | 0.0 |
| SN(E/C) |
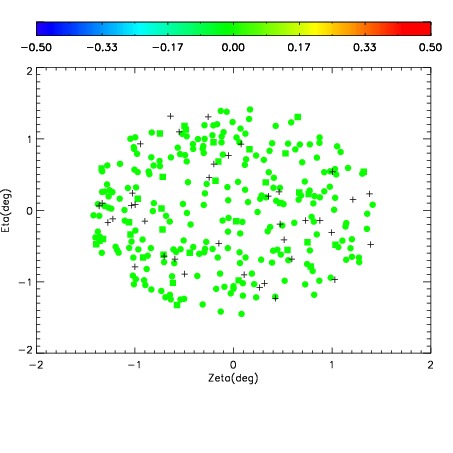
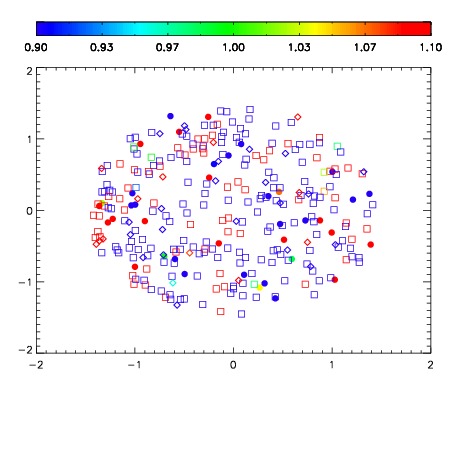
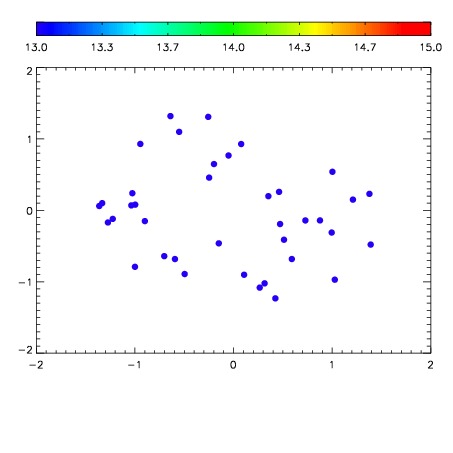

| Frame | Nreads | Zeropoints | Mag plots | Spatial mag deviation | Spatial sky 16325A emission deviations (filled: sky, open: star) | Spatial sky continuum emission | Spatial sky telluric CO2 absorption deviations (filled: H < 10) | |||||||||||||||||||||||
| 0 | 0 |
|
|
|
|
|
|
| IPAIR | NAME | SHIFT | NEWSHIFT | S/N | NAME | SHIFT | NEWSHIFT | S/N |
| 0 | 03210053 | 0.00000 | 0.00000 | 190.314 | 03210062 | -0.508338 | 0.508338 | 222.830 |
| 1 | 03210057 | -0.00696170 | 0.00696170 | 231.239 | 03210058 | -0.508760 | 0.508760 | 230.614 |
| 2 | 03210061 | -0.00447640 | 0.00447640 | 189.635 | 03210059 | -0.510157 | 0.510157 | 221.885 |
| 3 | 03210056 | -0.00926482 | 0.00926482 | 186.076 | 03210054 | -0.511300 | 0.511300 | 205.905 |
| 4 | 03210060 | -0.00674886 | 0.00674886 | 174.396 | 03210055 | -0.511507 | 0.511507 | 176.095 |