| Red | Green | Blue | |
| z | 17.64 | ||
| znorm | Inf | ||
| sky | -Inf | -Inf | -Inf |
| S/N | 29.8 | 50.7 | 54.8 |
| S/N(c) | 0.0 | 0.0 | 0.0 |
| SN(E/C) |

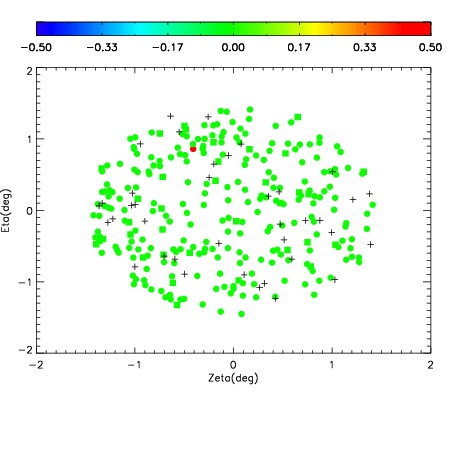

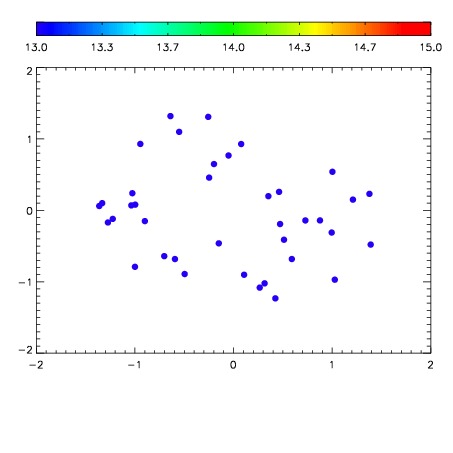

| Frame | Nreads | Zeropoints | Mag plots | Spatial mag deviation | Spatial sky 16325A emission deviations (filled: sky, open: star) | Spatial sky continuum emission | Spatial sky telluric CO2 absorption deviations (filled: H < 10) | |||||||||||||||||||||||
| 0 | 0 |
|
|
|
|
|
|
| IPAIR | NAME | SHIFT | NEWSHIFT | S/N | NAME | SHIFT | NEWSHIFT | S/N |
| 0 | 03720062 | 0.507035 | 0.00000 | 244.632 | 03720064 | 0.000259677 | 0.506775 | 244.492 |
| 1 | 03720065 | 0.501207 | 0.00582802 | 245.921 | 03720067 | 0.00130109 | 0.505734 | 244.981 |
| 2 | 03720061 | 0.505811 | 0.00122404 | 244.173 | 03720063 | 0.00187475 | 0.505160 | 244.442 |
| 3 | 03720066 | 0.505076 | 0.00195903 | 243.082 | 03720060 | 0.00000 | 0.507035 | 244.033 |