| Red | Green | Blue | |
| z | 17.64 | ||
| znorm | Inf | ||
| sky | -Inf | -Inf | -Inf |
| S/N | 25.5 | 42.7 | 49.4 |
| S/N(c) | 0.0 | 0.0 | 0.0 |
| SN(E/C) |
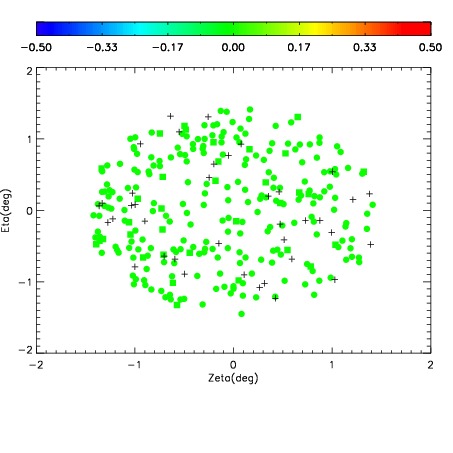
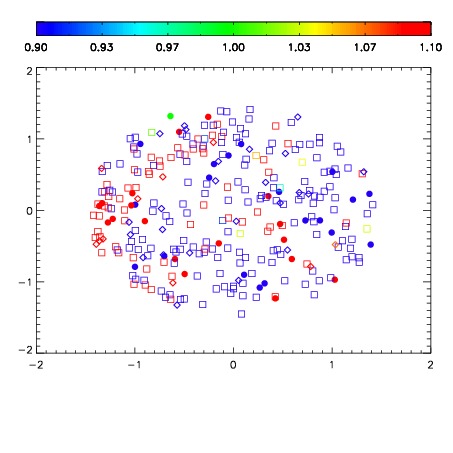
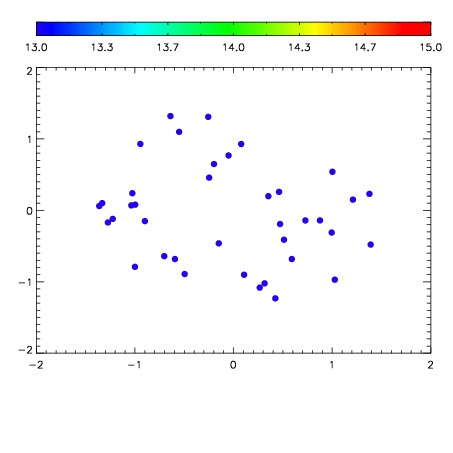

| Frame | Nreads | Zeropoints | Mag plots | Spatial mag deviation | Spatial sky 16325A emission deviations (filled: sky, open: star) | Spatial sky continuum emission | Spatial sky telluric CO2 absorption deviations (filled: H < 10) | |||||||||||||||||||||||
| 0 | 0 |
|
|
|
|
|
|
| IPAIR | NAME | SHIFT | NEWSHIFT | S/N | NAME | SHIFT | NEWSHIFT | S/N |
| 0 | 03980036 | 0.496029 | 0.00000 | 192.453 | 03980037 | 0.000390561 | 0.495638 | 194.966 |
| 1 | 03980039 | 0.494175 | 0.00185400 | 193.060 | 03980038 | -0.000214515 | 0.496244 | 197.980 |
| 2 | 03980040 | 0.494987 | 0.00104198 | 190.267 | 03980041 | 0.00317797 | 0.492851 | 192.806 |
| 3 | 03980035 | 0.495892 | 0.000137001 | 186.447 | 03980034 | 0.00000 | 0.496029 | 176.157 |