| Red | Green | Blue | |
| z | 17.64 | ||
| znorm | Inf | ||
| sky | -Inf | -Inf | -Inf |
| S/N | 33.3 | 55.0 | 61.5 |
| S/N(c) | 0.0 | 0.0 | 0.0 |
| SN(E/C) |
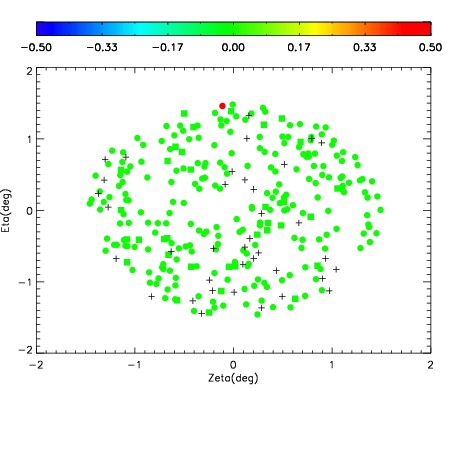
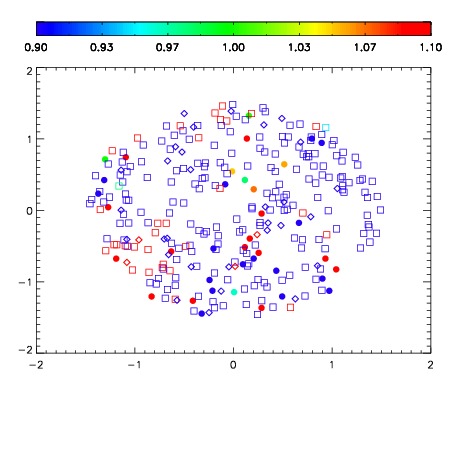
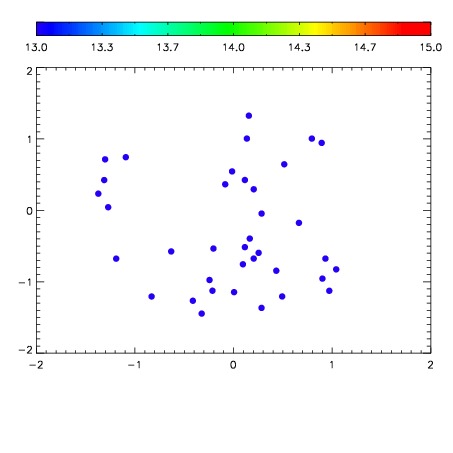

| Frame | Nreads | Zeropoints | Mag plots | Spatial mag deviation | Spatial sky 16325A emission deviations (filled: sky, open: star) | Spatial sky continuum emission | Spatial sky telluric CO2 absorption deviations (filled: H < 10) | |||||||||||||||||||||||
| 0 | 0 |
|
|
|
|
|
|
| IPAIR | NAME | SHIFT | NEWSHIFT | S/N | NAME | SHIFT | NEWSHIFT | S/N |
| 0 | 02870107 | 0.414803 | 0.00000 | 221.342 | 02870104 | 0.00469230 | 0.410111 | 219.315 |
| 1 | 02870103 | 0.412931 | 0.00187200 | 224.741 | 02870105 | 0.00190205 | 0.412901 | 219.540 |
| 2 | 02870102 | 0.411663 | 0.00314000 | 221.303 | 02870108 | 0.00779074 | 0.407012 | 219.208 |
| 3 | 02870106 | 0.414540 | 0.000263005 | 221.024 | 02870101 | 0.000980260 | 0.413823 | 217.027 |
| 4 | 02870099 | 0.411086 | 0.00371701 | 218.987 | 02870100 | 0.00285456 | 0.411948 | 216.217 |
| 5 | 02870098 | 0.408027 | 0.00677601 | 217.551 | 02870097 | 0.00000 | 0.414803 | 208.617 |