| Red | Green | Blue | |
| z | 17.64 | ||
| znorm | Inf | ||
| sky | -Inf | -NaN | -Inf |
| S/N | 3.8 | 7.0 | 7.5 |
| S/N(c) | 0.0 | 0.0 | 0.0 |
| SN(E/C) |

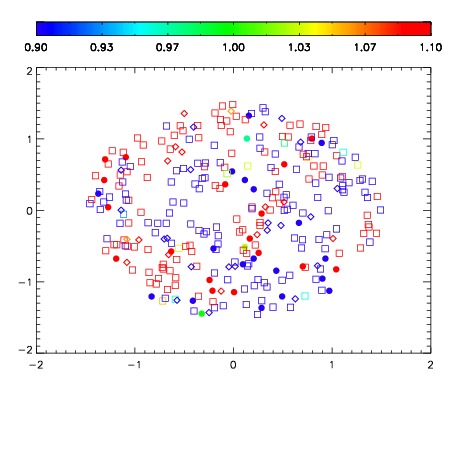
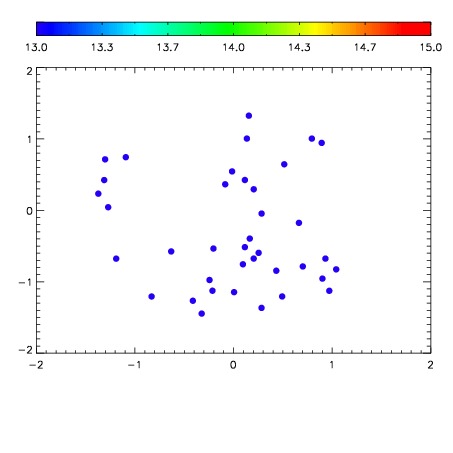

| Frame | Nreads | Zeropoints | Mag plots | Spatial mag deviation | Spatial sky 16325A emission deviations (filled: sky, open: star) | Spatial sky continuum emission | Spatial sky telluric CO2 absorption deviations (filled: H < 10) | |||||||||||||||||||||||
| 0 | 0 |
|
|
|
|
|
|
| IPAIR | NAME | SHIFT | NEWSHIFT | S/N | NAME | SHIFT | NEWSHIFT | S/N |
| 0 | 03990037 | 0.501863 | 0.00000 | 65.1614 | 03990035 | 0.00271953 | 0.499143 | 49.0873 |
| 1 | 03990032 | 0.498913 | 0.00295001 | 99.3652 | 03990031 | 0.00000 | 0.501863 | 94.1539 |
| 2 | 03990033 | 0.499525 | 0.00233799 | 65.0234 | 03990034 | 0.00340826 | 0.498455 | 38.4668 |