| Red | Green | Blue | |
| z | 17.64 | ||
| znorm | Inf | ||
| sky | -Inf | -Inf | -Inf |
| S/N | 27.1 | 46.0 | 50.6 |
| S/N(c) | 0.0 | 0.0 | 0.0 |
| SN(E/C) |
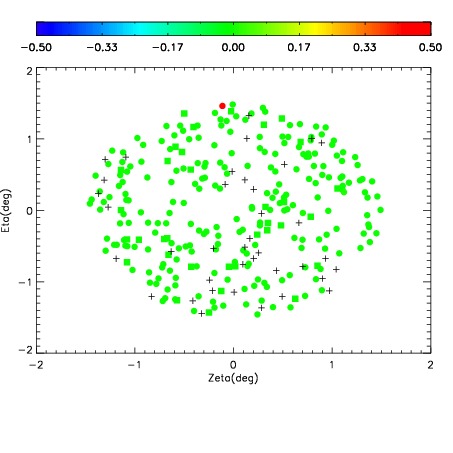
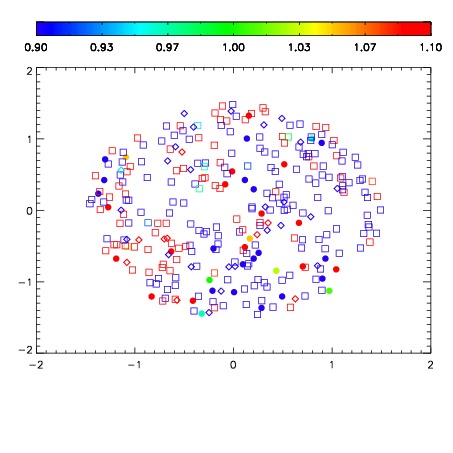
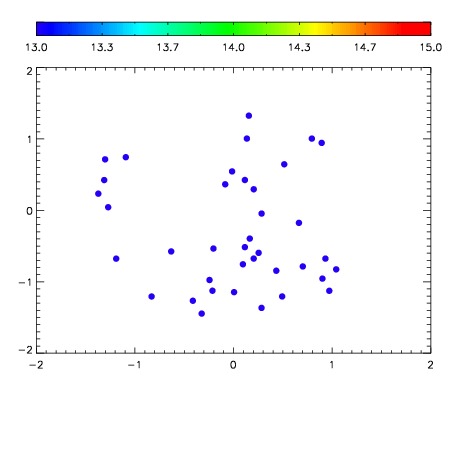

| Frame | Nreads | Zeropoints | Mag plots | Spatial mag deviation | Spatial sky 16325A emission deviations (filled: sky, open: star) | Spatial sky continuum emission | Spatial sky telluric CO2 absorption deviations (filled: H < 10) | |||||||||||||||||||||||
| 0 | 0 |
|
|
|
|
|
|
| IPAIR | NAME | SHIFT | NEWSHIFT | S/N | NAME | SHIFT | NEWSHIFT | S/N |
| 0 | 04040027 | 0.494737 | 0.00000 | 206.109 | 04040028 | 0.00113035 | 0.493607 | 212.089 |
| 1 | 04040031 | 0.493877 | 0.000860006 | 226.791 | 04040032 | -0.000359096 | 0.495096 | 231.403 |
| 2 | 04040030 | 0.493231 | 0.00150600 | 223.587 | 04040029 | -0.000877934 | 0.495615 | 217.300 |
| 3 | 04040026 | 0.494083 | 0.000654012 | 198.760 | 04040025 | 0.00000 | 0.494737 | 203.777 |