| Red | Green | Blue | |
| z | 17.64 | ||
| znorm | Inf | ||
| sky | -Inf | -NaN | -Inf |
| S/N | 29.1 | 48.5 | 51.6 |
| S/N(c) | 0.0 | 0.0 | 0.0 |
| SN(E/C) |
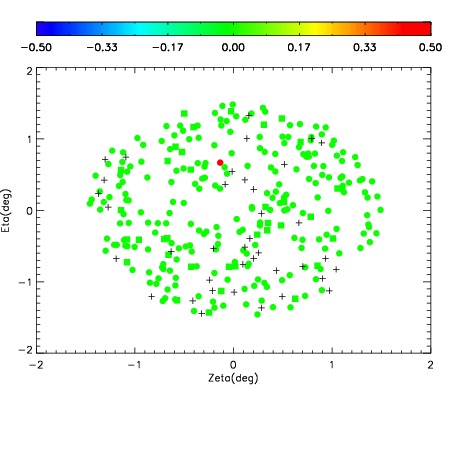
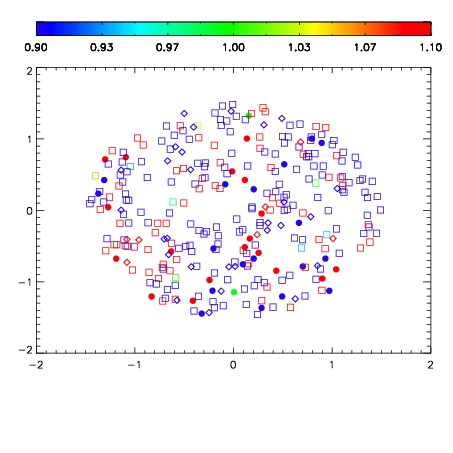
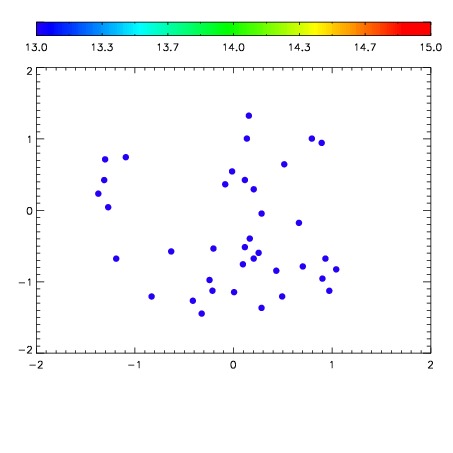

| Frame | Nreads | Zeropoints | Mag plots | Spatial mag deviation | Spatial sky 16325A emission deviations (filled: sky, open: star) | Spatial sky continuum emission | Spatial sky telluric CO2 absorption deviations (filled: H < 10) | |||||||||||||||||||||||
| 0 | 0 |
|
|
|
|
|
|
| IPAIR | NAME | SHIFT | NEWSHIFT | S/N | NAME | SHIFT | NEWSHIFT | S/N |
| 0 | 10300029 | 0.492193 | 0.00000 | 221.024 | 10300027 | 0.00000 | 0.492193 | 221.391 |
| 1 | 10300028 | 0.492075 | 0.000118017 | 224.128 | 10300031 | 0.00338170 | 0.488811 | 225.265 |
| 2 | 10300032 | 0.488947 | 0.00324601 | 223.313 | 10300030 | 0.00260590 | 0.489587 | 223.641 |
| 3 | 10300033 | 0.489930 | 0.00226301 | 218.278 | 10300034 | 0.00156930 | 0.490624 | 215.661 |