| Red | Green | Blue | |
| z | 17.64 | ||
| znorm | Inf | ||
| sky | -Inf | -Inf | -Inf |
| S/N | 28.5 | 43.3 | 39.6 |
| S/N(c) | 0.0 | 0.0 | 0.0 |
| SN(E/C) |
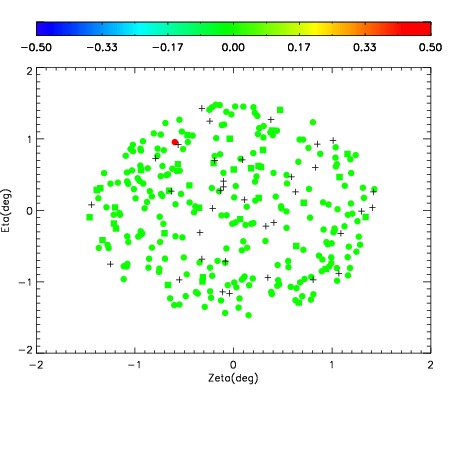
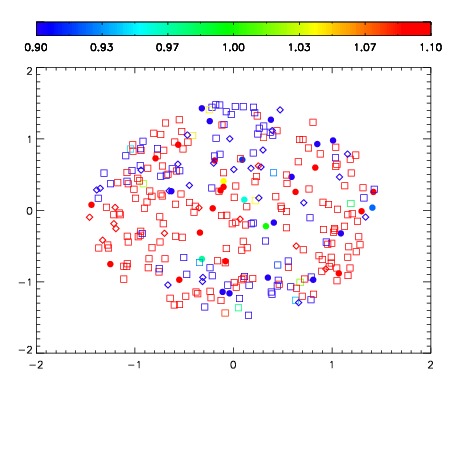
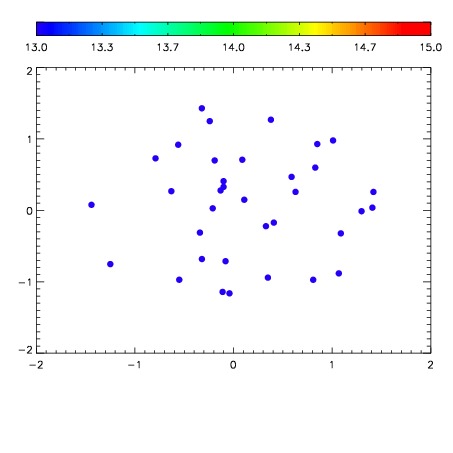

| Frame | Nreads | Zeropoints | Mag plots | Spatial mag deviation | Spatial sky 16325A emission deviations (filled: sky, open: star) | Spatial sky continuum emission | Spatial sky telluric CO2 absorption deviations (filled: H < 10) | |||||||||||||||||||||||
| 0 | 0 |
|
|
|
|
|
|
| IPAIR | NAME | SHIFT | NEWSHIFT | S/N | NAME | SHIFT | NEWSHIFT | S/N |
| 0 | 10220013 | 0.488265 | 0.00000 | 180.372 | 10220012 | 0.00000 | 0.488265 | 190.356 |
| 1 | 10220018 | 0.486643 | 0.00162202 | 193.301 | 10220019 | -0.00207734 | 0.490342 | 199.308 |
| 2 | 10220017 | 0.486176 | 0.00208899 | 190.503 | 10220016 | -0.00155212 | 0.489817 | 191.173 |
| 3 | 10220014 | 0.487997 | 0.000268012 | 171.324 | 10220015 | -0.00120805 | 0.489473 | 180.895 |