| Red | Green | Blue | |
| z | 17.64 | ||
| znorm | Inf | ||
| sky | -NaN | -Inf | -Inf |
| S/N | 30.4 | 48.1 | 44.7 |
| S/N(c) | 0.0 | 0.0 | 0.0 |
| SN(E/C) |
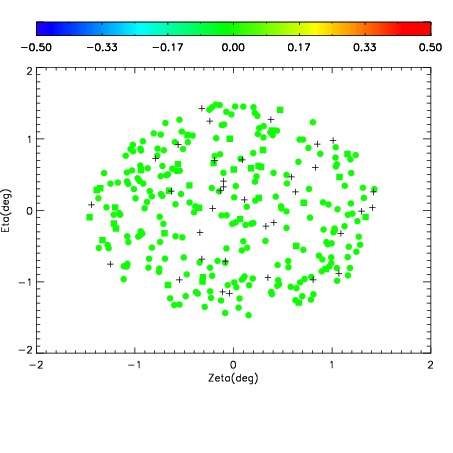
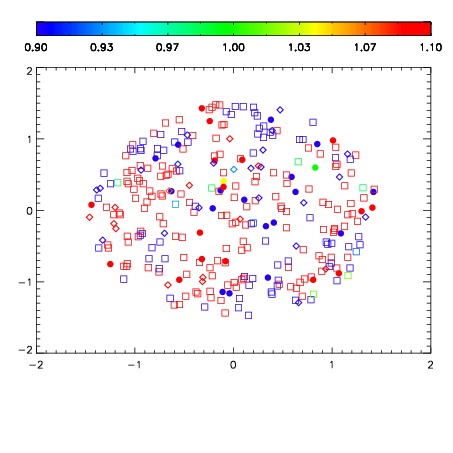
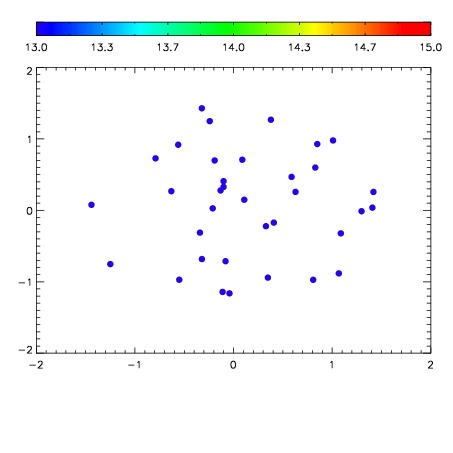

| Frame | Nreads | Zeropoints | Mag plots | Spatial mag deviation | Spatial sky 16325A emission deviations (filled: sky, open: star) | Spatial sky continuum emission | Spatial sky telluric CO2 absorption deviations (filled: H < 10) | |||||||||||||||||||||||
| 0 | 0 |
|
|
|
|
|
|
| IPAIR | NAME | SHIFT | NEWSHIFT | S/N | NAME | SHIFT | NEWSHIFT | S/N |
| 0 | 10230013 | 0.501161 | 0.00000 | 216.871 | 10230012 | 0.00000 | 0.501161 | 210.566 |
| 1 | 10230018 | 0.499956 | 0.00120497 | 225.930 | 10230019 | -9.80968e-05 | 0.501259 | 224.337 |
| 2 | 10230017 | 0.499777 | 0.00138399 | 217.933 | 10230016 | -0.00124800 | 0.502409 | 215.454 |
| 3 | 10230014 | 0.501014 | 0.000146985 | 215.008 | 10230015 | -0.000933229 | 0.502094 | 207.081 |