| Red | Green | Blue | |
| z | 17.64 | ||
| znorm | Inf | ||
| sky | -Inf | -Inf | -Inf |
| S/N | 28.0 | 44.9 | 46.4 |
| S/N(c) | 0.0 | 0.0 | 0.0 |
| SN(E/C) |
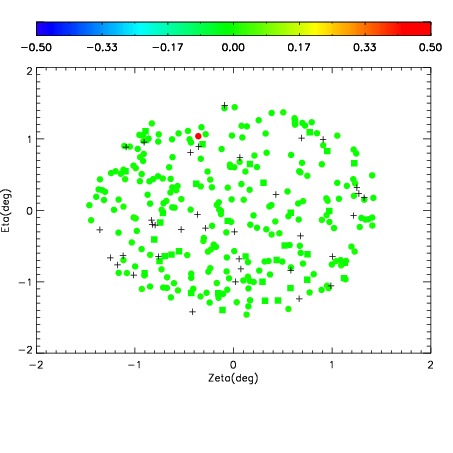

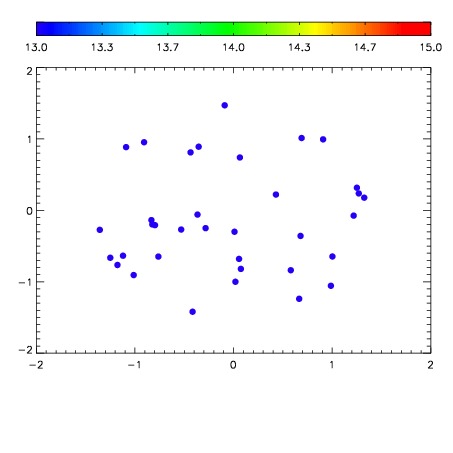

| Frame | Nreads | Zeropoints | Mag plots | Spatial mag deviation | Spatial sky 16325A emission deviations (filled: sky, open: star) | Spatial sky continuum emission | Spatial sky telluric CO2 absorption deviations (filled: H < 10) | |||||||||||||||||||||||
| 0 | 0 |
|
|
|
|
|
|
| IPAIR | NAME | SHIFT | NEWSHIFT | S/N | NAME | SHIFT | NEWSHIFT | S/N |
| 0 | 09050053 | 0.484842 | 0.00000 | 195.934 | 09050054 | 0.00370257 | 0.481139 | 197.340 |
| 1 | 09050052 | 0.484581 | 0.000261009 | 191.878 | 09050051 | 0.00301883 | 0.481823 | 194.342 |
| 2 | 09050049 | 0.480108 | 0.00473401 | 189.898 | 09050050 | 0.00315475 | 0.481687 | 190.974 |
| 3 | 09050048 | 0.480334 | 0.00450799 | 188.713 | 09050047 | 0.00000 | 0.484842 | 188.380 |