| Red | Green | Blue | |
| z | 17.64 | ||
| znorm | Inf | ||
| sky | -NaN | -Inf | -Inf |
| S/N | 31.0 | 51.4 | 53.8 |
| S/N(c) | 0.0 | 0.0 | 0.0 |
| SN(E/C) |
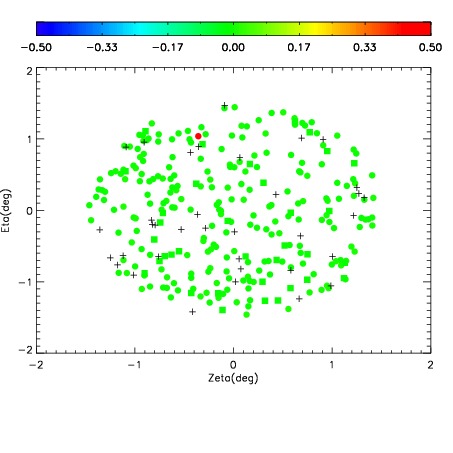
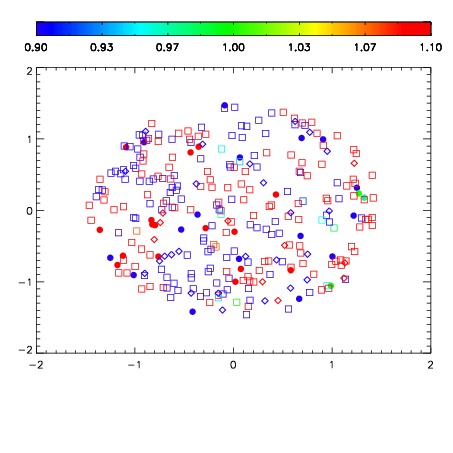
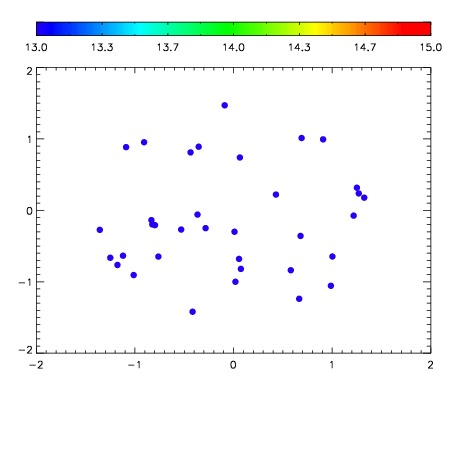

| Frame | Nreads | Zeropoints | Mag plots | Spatial mag deviation | Spatial sky 16325A emission deviations (filled: sky, open: star) | Spatial sky continuum emission | Spatial sky telluric CO2 absorption deviations (filled: H < 10) | |||||||||||||||||||||||
| 0 | 0 |
|
|
|
|
|
|
| IPAIR | NAME | SHIFT | NEWSHIFT | S/N | NAME | SHIFT | NEWSHIFT | S/N |
| 0 | 09950017 | 0.524140 | 0.00000 | 199.082 | 09950019 | 0.000864208 | 0.523276 | 195.423 |
| 1 | 09950020 | 0.523531 | 0.000608981 | 204.924 | 09950022 | 0.00274243 | 0.521398 | 201.886 |
| 2 | 09950021 | 0.523784 | 0.000356019 | 203.968 | 09950018 | 0.00104448 | 0.523096 | 201.309 |
| 3 | 09950016 | 0.524043 | 9.69768e-05 | 196.567 | 09950015 | 0.00000 | 0.524140 | 190.275 |