| Red | Green | Blue | |
| z | 17.64 | ||
| znorm | Inf | ||
| sky | -NaN | -NaN | -Inf |
| S/N | 29.7 | 47.6 | 52.5 |
| S/N(c) | 0.0 | 0.0 | 0.0 |
| SN(E/C) |
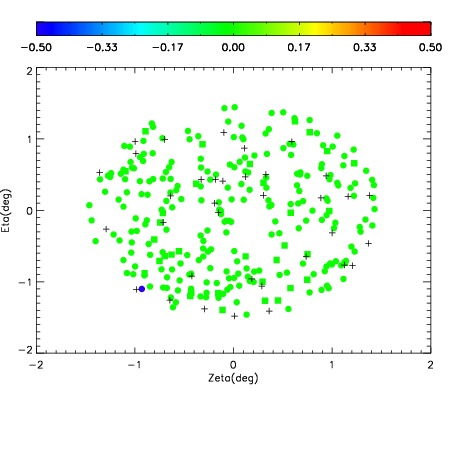
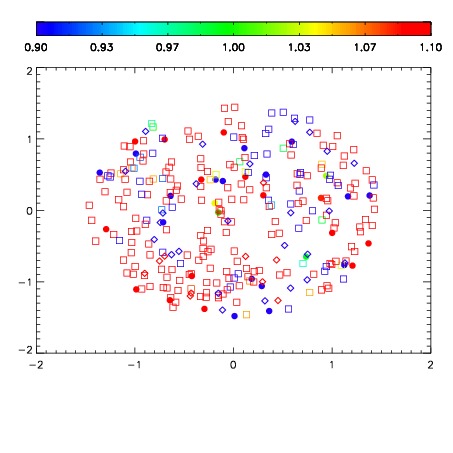
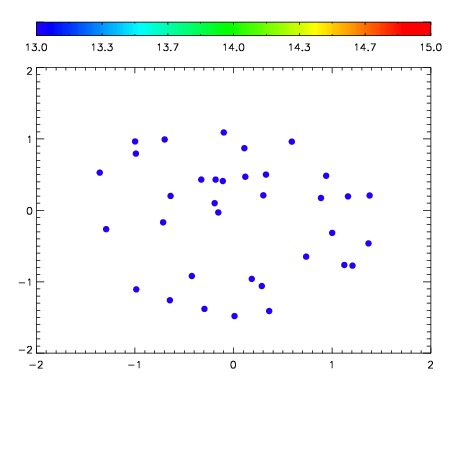

| Frame | Nreads | Zeropoints | Mag plots | Spatial mag deviation | Spatial sky 16325A emission deviations (filled: sky, open: star) | Spatial sky continuum emission | Spatial sky telluric CO2 absorption deviations (filled: H < 10) | |||||||||||||||||||||||
| 0 | 0 |
|
|
|
|
|
|
| IPAIR | NAME | SHIFT | NEWSHIFT | S/N | NAME | SHIFT | NEWSHIFT | S/N |
| 0 | 10150028 | 0.493211 | 0.00000 | 226.401 | 10150033 | 0.00288784 | 0.490323 | 225.439 |
| 1 | 10150031 | 0.491331 | 0.00187999 | 230.584 | 10150030 | -0.00130323 | 0.494514 | 229.989 |
| 2 | 10150032 | 0.491947 | 0.00126401 | 224.317 | 10150029 | -0.000998188 | 0.494209 | 224.702 |
| 3 | 10150027 | 0.492391 | 0.000820011 | 222.117 | 10150026 | 0.00000 | 0.493211 | 219.469 |