| Red | Green | Blue | |
| z | 17.64 | ||
| znorm | Inf | ||
| sky | -Inf | -Inf | -Inf |
| S/N | 25.3 | 41.7 | 47.4 |
| S/N(c) | 0.0 | 0.0 | 0.0 |
| SN(E/C) |
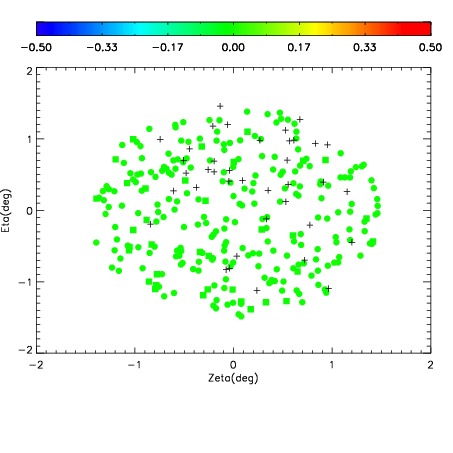
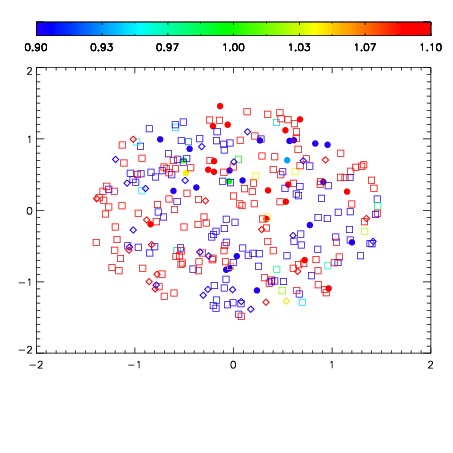
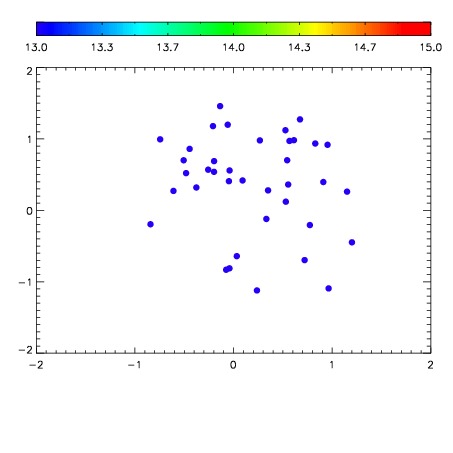

| Frame | Nreads | Zeropoints | Mag plots | Spatial mag deviation | Spatial sky 16325A emission deviations (filled: sky, open: star) | Spatial sky continuum emission | Spatial sky telluric CO2 absorption deviations (filled: H < 10) | |||||||||||||||||||||||
| 0 | 0 |
|
|
|
|
|
|
| IPAIR | NAME | SHIFT | NEWSHIFT | S/N | NAME | SHIFT | NEWSHIFT | S/N |
| 0 | 03090025 | 0.500748 | 0.00000 | 181.065 | 03090026 | 0.00198216 | 0.498766 | 190.077 |
| 1 | 03090028 | 0.494823 | 0.00592497 | 187.481 | 03090027 | 0.00117066 | 0.499577 | 191.073 |
| 2 | 03090029 | 0.495993 | 0.00475499 | 181.177 | 03090023 | 0.00000 | 0.500748 | 190.140 |
| 3 | 03090024 | 0.500488 | 0.000259995 | 174.015 | 03090030 | 0.00539867 | 0.495349 | 179.341 |