| Red | Green | Blue | |
| z | 17.64 | ||
| znorm | Inf | ||
| sky | -Inf | -Inf | -Inf |
| S/N | 18.3 | 32.4 | 37.1 |
| S/N(c) | 0.0 | 0.0 | 0.0 |
| SN(E/C) |
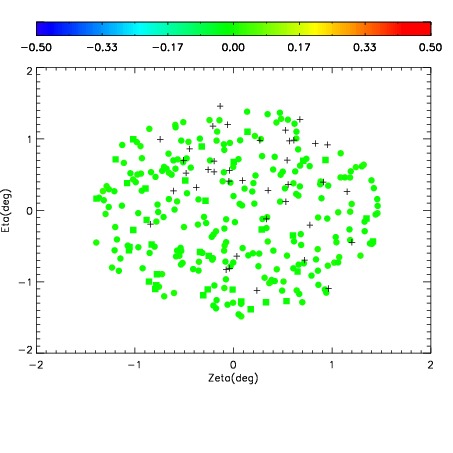
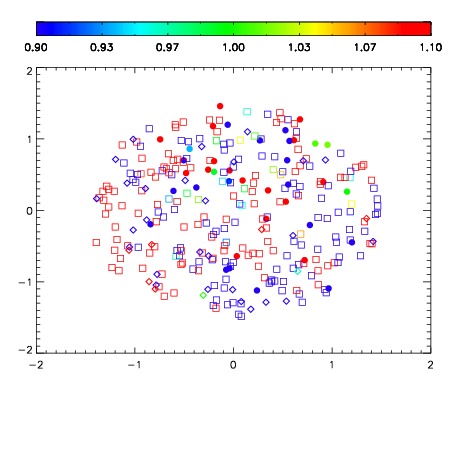
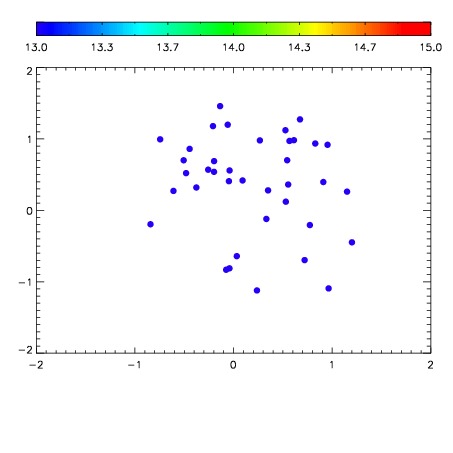

| Frame | Nreads | Zeropoints | Mag plots | Spatial mag deviation | Spatial sky 16325A emission deviations (filled: sky, open: star) | Spatial sky continuum emission | Spatial sky telluric CO2 absorption deviations (filled: H < 10) | |||||||||||||||||||||||
| 0 | 0 |
|
|
|
|
|
|
| IPAIR | NAME | SHIFT | NEWSHIFT | S/N | NAME | SHIFT | NEWSHIFT | S/N |
| 0 | 09100050 | 0.478773 | 0.00000 | 176.645 | 09100051 | -0.000756373 | 0.479529 | 188.491 |
| 1 | 09100045 | 0.476523 | 0.00224999 | 168.154 | 09100044 | 0.00000 | 0.478773 | 164.084 |
| 2 | 09100049 | 0.477631 | 0.00114200 | 144.653 | 09100048 | 0.00204621 | 0.476727 | 129.017 |
| 3 | 09100046 | 0.476729 | 0.00204399 | 119.483 | 09100047 | 0.00254782 | 0.476225 | 123.766 |