| Red | Green | Blue | |
| z | 17.64 | ||
| znorm | Inf | ||
| sky | -Inf | -NaN | -Inf |
| S/N | 32.3 | 55.4 | 57.7 |
| S/N(c) | 0.0 | 0.0 | 0.0 |
| SN(E/C) |
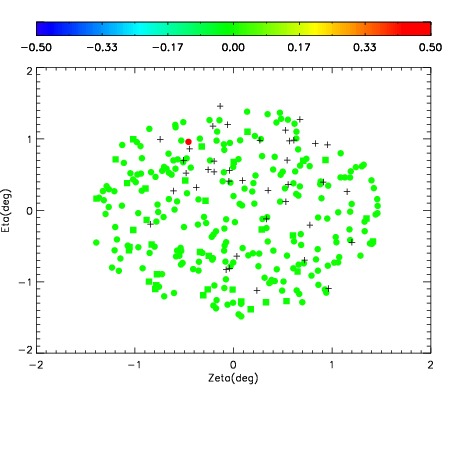
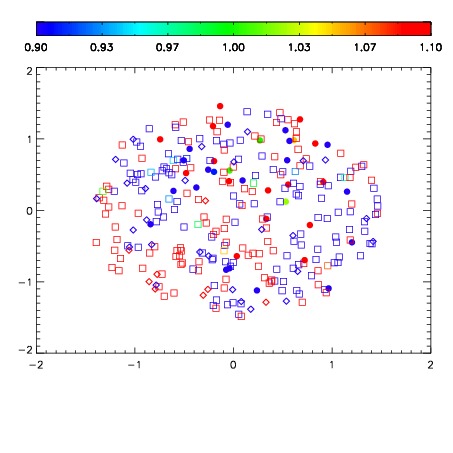
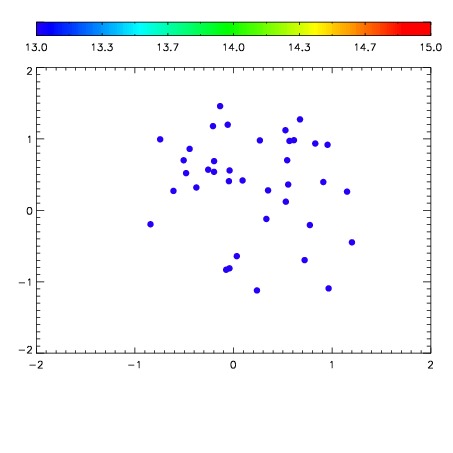

| Frame | Nreads | Zeropoints | Mag plots | Spatial mag deviation | Spatial sky 16325A emission deviations (filled: sky, open: star) | Spatial sky continuum emission | Spatial sky telluric CO2 absorption deviations (filled: H < 10) | |||||||||||||||||||||||
| 0 | 0 |
|
|
|
|
|
|
| IPAIR | NAME | SHIFT | NEWSHIFT | S/N | NAME | SHIFT | NEWSHIFT | S/N |
| 0 | 09950039 | 0.524507 | 0.00000 | 211.508 | 09950037 | 0.00000 | 0.524507 | 208.400 |
| 1 | 09950038 | 0.524359 | 0.000147998 | 214.107 | 09950040 | 0.00360264 | 0.520904 | 209.862 |
| 2 | 09950042 | 0.523180 | 0.00132698 | 206.554 | 09950041 | 0.00379847 | 0.520709 | 206.418 |
| 3 | 09950043 | 0.522916 | 0.00159097 | 206.260 | 09950044 | 0.00154390 | 0.522963 | 204.232 |