| Red | Green | Blue | |
| z | 17.64 | ||
| znorm | Inf | ||
| sky | -Inf | -Inf | -Inf |
| S/N | 30.8 | 52.5 | 53.9 |
| S/N(c) | 0.0 | 0.0 | 0.0 |
| SN(E/C) |
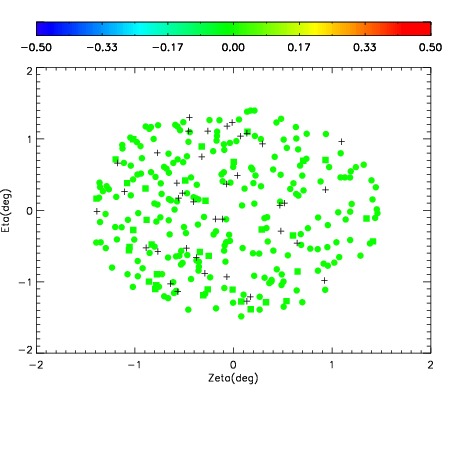
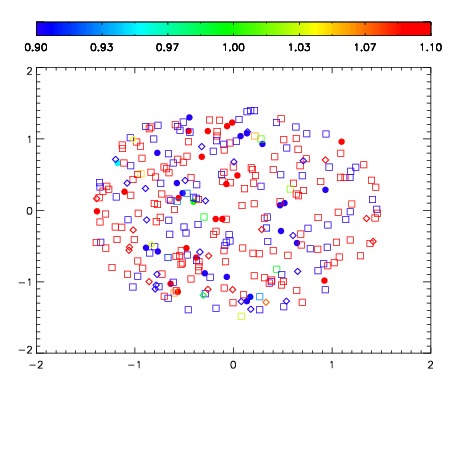
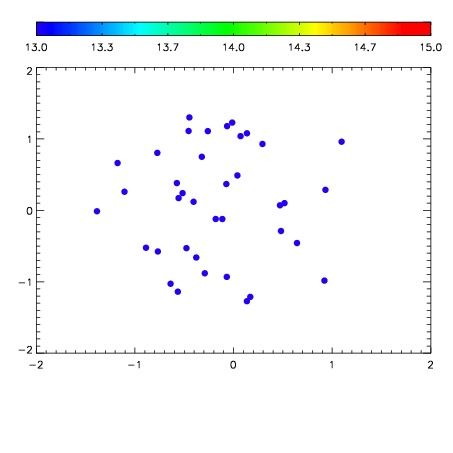

| Frame | Nreads | Zeropoints | Mag plots | Spatial mag deviation | Spatial sky 16325A emission deviations (filled: sky, open: star) | Spatial sky continuum emission | Spatial sky telluric CO2 absorption deviations (filled: H < 10) | |||||||||||||||||||||||
| 0 | 0 |
|
|
|
|
|
|
| IPAIR | NAME | SHIFT | NEWSHIFT | S/N | NAME | SHIFT | NEWSHIFT | S/N |
| 0 | 03050025 | 0.501544 | 0.00000 | 205.026 | 03050024 | 0.00000 | 0.501544 | 202.585 |
| 1 | 03050026 | 0.501487 | 5.69820e-05 | 201.489 | 03050028 | -0.000258038 | 0.501802 | 200.048 |
| 2 | 03050030 | 0.498989 | 0.00255501 | 197.011 | 03050027 | 0.00127701 | 0.500267 | 198.739 |
| 3 | 03050029 | 0.498159 | 0.00338501 | 194.362 | 03050031 | 0.000327346 | 0.501217 | 193.811 |