| Red | Green | Blue | |
| z | 17.64 | ||
| znorm | Inf | ||
| sky | -Inf | -Inf | -Inf |
| S/N | 22.5 | 39.8 | 41.4 |
| S/N(c) | 0.0 | 0.0 | 0.0 |
| SN(E/C) |
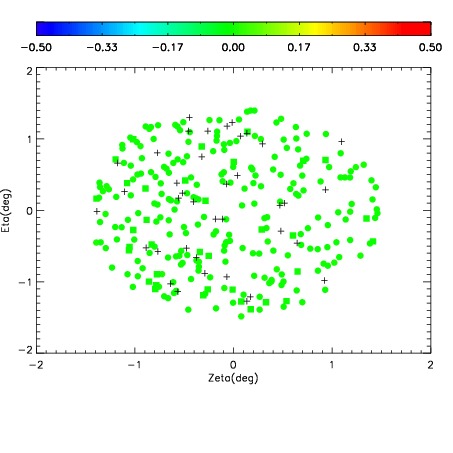
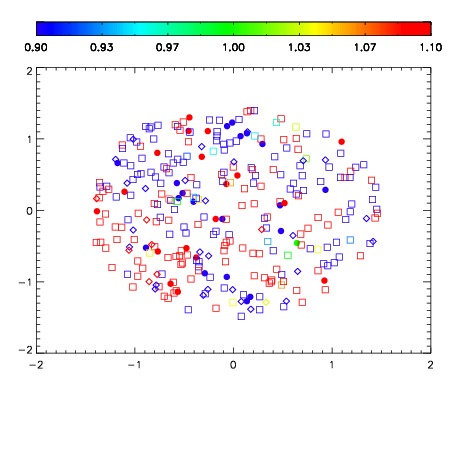
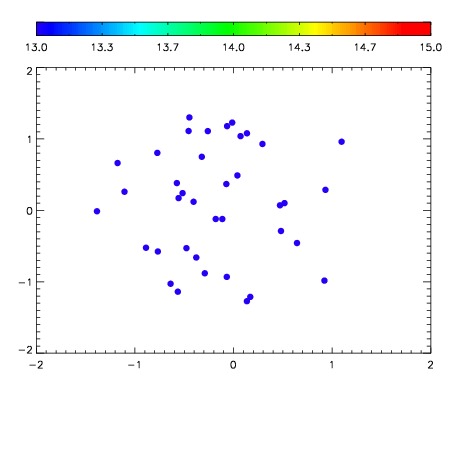

| Frame | Nreads | Zeropoints | Mag plots | Spatial mag deviation | Spatial sky 16325A emission deviations (filled: sky, open: star) | Spatial sky continuum emission | Spatial sky telluric CO2 absorption deviations (filled: H < 10) | |||||||||||||||||||||||
| 0 | 0 |
|
|
|
|
|
|
| IPAIR | NAME | SHIFT | NEWSHIFT | S/N | NAME | SHIFT | NEWSHIFT | S/N |
| 0 | 09150017 | 0.480677 | 0.00000 | 133.072 | 09150014 | -0.000884052 | 0.481561 | 144.943 |
| 1 | 09150013 | 0.479124 | 0.00155300 | 186.821 | 09150011 | 0.00000 | 0.480677 | 186.794 |
| 2 | 09150016 | 0.479544 | 0.00113299 | 166.276 | 09150015 | -0.000506123 | 0.481183 | 161.976 |
| 3 | 09150012 | 0.479571 | 0.00110599 | 164.229 | 09150019 | 0.000375783 | 0.480301 | 151.868 |
| 4 | 09150020 | 0.480112 | 0.000565022 | 124.802 | 09150018 | 0.000559432 | 0.480118 | 92.9365 |