| Red | Green | Blue | |
| z | 17.64 | ||
| znorm | Inf | ||
| sky | -Inf | -Inf | -Inf |
| S/N | 29.0 | 48.3 | 51.8 |
| S/N(c) | 0.0 | 0.0 | 0.0 |
| SN(E/C) |
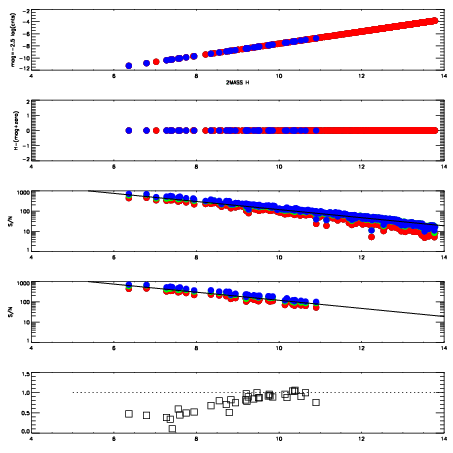
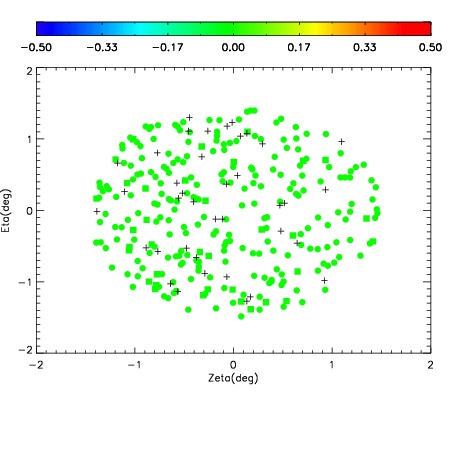
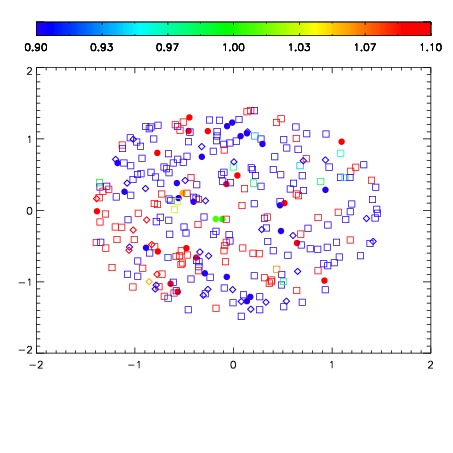
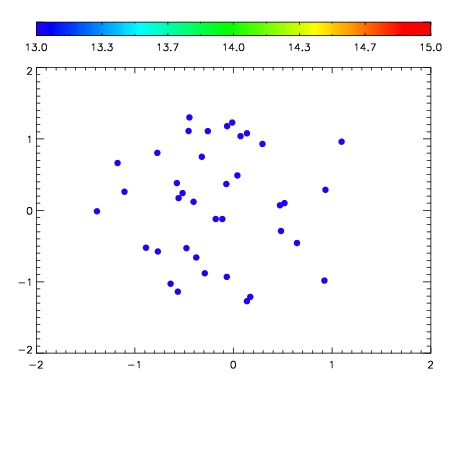

| Frame | Nreads | Zeropoints | Mag plots | Spatial mag deviation | Spatial sky 16325A emission deviations (filled: sky, open: star) | Spatial sky continuum emission | Spatial sky telluric CO2 absorption deviations (filled: H < 10) | |||||||||||||||||||||||
| 0 | 0 |
|
|
|
|
|
|
| IPAIR | NAME | SHIFT | NEWSHIFT | S/N | NAME | SHIFT | NEWSHIFT | S/N |
| 0 | 09160012 | 0.478525 | 0.00000 | 199.316 | 09160011 | 0.00000 | 0.478525 | 196.290 |
| 1 | 09160013 | 0.476918 | 0.00160700 | 199.362 | 09160014 | -0.00146966 | 0.479995 | 200.021 |
| 2 | 09160016 | 0.476434 | 0.00209102 | 190.195 | 09160015 | -0.00131092 | 0.479836 | 193.539 |
| 3 | 09160017 | 0.477406 | 0.00111902 | 189.796 | 09160018 | -0.00145874 | 0.479984 | 188.396 |