| Red | Green | Blue | |
| z | 17.64 | ||
| znorm | Inf | ||
| sky | -NaN | -Inf | -Inf |
| S/N | 35.5 | 55.6 | 62.5 |
| S/N(c) | 35.5 | 55.6 | 62.5 |
| SN(E/C) |
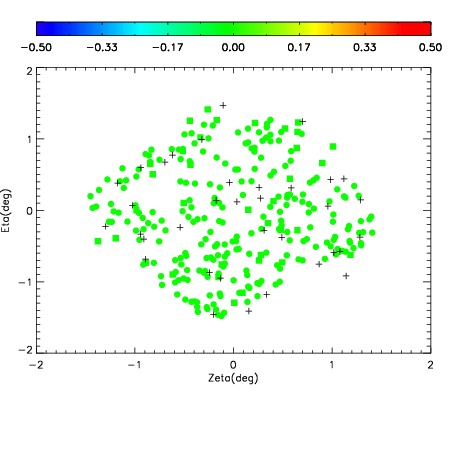
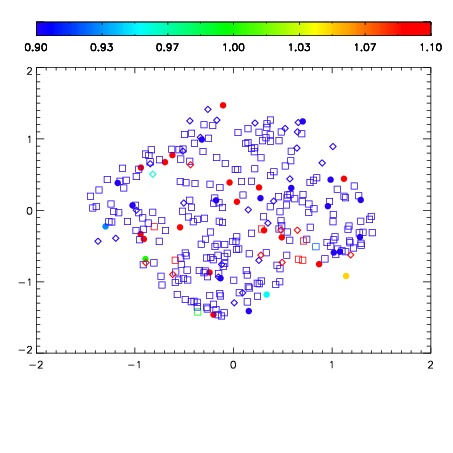
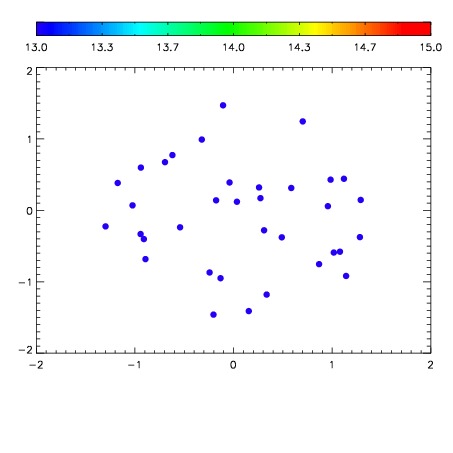

| Frame | Nreads | Zeropoints | Mag plots | Spatial mag deviation | Spatial sky 16325A emission deviations (filled: sky, open: star) | Spatial sky continuum emission | Spatial sky telluric CO2 absorption deviations (filled: H < 10) | |||||||||||||||||||||||
| 0 | 0 |
|
|
|
|
|
|
| IPAIR | NAME | SHIFT | NEWSHIFT | S/N | NAME | SHIFT | NEWSHIFT | S/N |
| 0 | 03140009 | 0.489878 | 0.00000 | 183.005 | 03140008 | 0.00000 | 0.489878 | 180.366 |
| 1 | 03140014 | 0.487285 | 0.00259301 | 194.458 | 03140015 | -0.00200827 | 0.491886 | 191.122 |
| 2 | 03140013 | 0.483222 | 0.00665599 | 191.797 | 03140011 | -9.14233e-05 | 0.489969 | 190.706 |
| 3 | 03140010 | 0.488812 | 0.00106600 | 187.845 | 03140012 | -0.00224970 | 0.492128 | 188.905 |