| Red | Green | Blue | |
| z | 17.64 | ||
| znorm | Inf | ||
| sky | -Inf | -Inf | -Inf |
| S/N | 32.9 | 46.6 | 55.1 |
| S/N(c) | 0.0 | 0.0 | 0.0 |
| SN(E/C) |

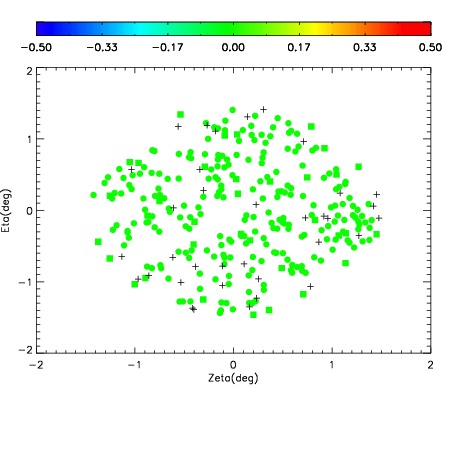
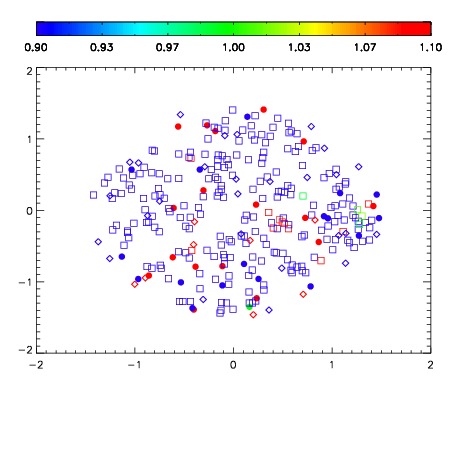
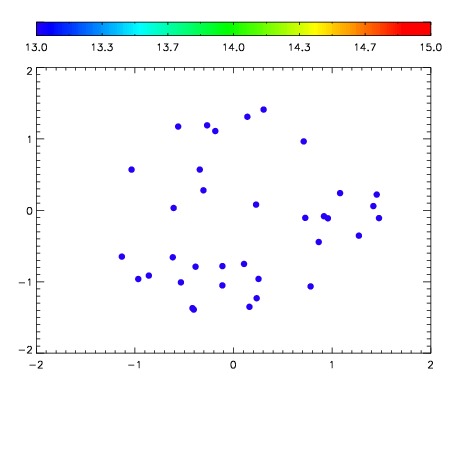

| Frame | Nreads | Zeropoints | Mag plots | Spatial mag deviation | Spatial sky 16325A emission deviations (filled: sky, open: star) | Spatial sky continuum emission | Spatial sky telluric CO2 absorption deviations (filled: H < 10) | |||||||||||||||||||||||
| 0 | 0 |
|
|
|
|
|
|
| IPAIR | NAME | SHIFT | NEWSHIFT | S/N | NAME | SHIFT | NEWSHIFT | S/N |
| 0 | 02820030 | 0.405756 | 0.00000 | 200.895 | 02820031 | 0.00175075 | 0.404005 | 200.032 |
| 1 | 02820025 | 0.400418 | 0.00533798 | 239.924 | 02820024 | 0.00000 | 0.405756 | 239.448 |
| 2 | 02820026 | 0.403913 | 0.00184301 | 235.119 | 02820027 | 0.00151688 | 0.404239 | 226.114 |
| 3 | 02820029 | 0.403961 | 0.00179499 | 209.947 | 02820028 | -0.000171148 | 0.405927 | 219.778 |