| Red | Green | Blue | |
| z | 17.64 | ||
| znorm | Inf | ||
| sky | -Inf | -NaN | -Inf |
| S/N | 21.9 | 36.6 | 41.3 |
| S/N(c) | 21.9 | 36.6 | 41.3 |
| SN(E/C) |
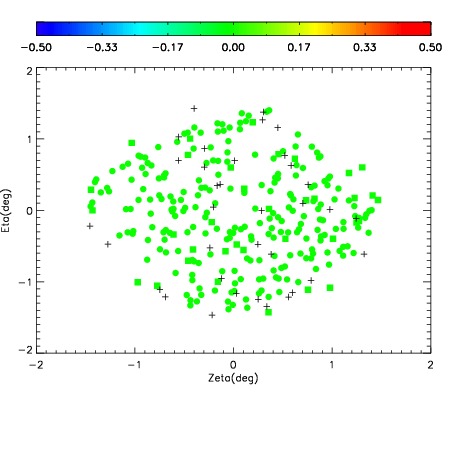
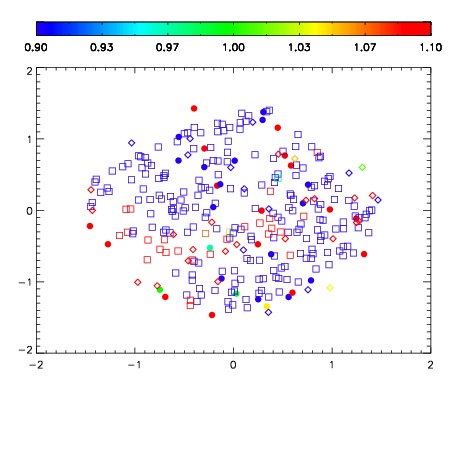
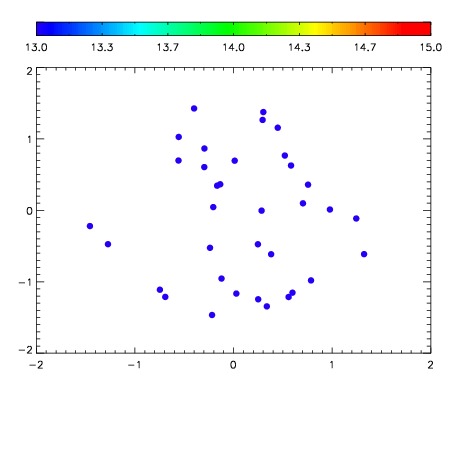

| Frame | Nreads | Zeropoints | Mag plots | Spatial mag deviation | Spatial sky 16325A emission deviations (filled: sky, open: star) | Spatial sky continuum emission | Spatial sky telluric CO2 absorption deviations (filled: H < 10) | |||||||||||||||||||||||
| 0 | 0 |
|
|
|
|
|
|
| IPAIR | NAME | SHIFT | NEWSHIFT | S/N | NAME | SHIFT | NEWSHIFT | S/N |
| 0 | 02790012 | 0.417830 | 0.00000 | 170.817 | 02790010 | 0.00000 | 0.417830 | 165.530 |
| 1 | 02790015 | 0.415721 | 0.00210899 | 196.943 | 02790017 | -0.000194354 | 0.418024 | 192.363 |
| 2 | 02790016 | 0.415106 | 0.00272399 | 195.216 | 02790014 | -0.00191947 | 0.419749 | 190.351 |
| 3 | 02790011 | 0.416906 | 0.000923991 | 178.825 | 02790013 | 0.00363894 | 0.414191 | 185.754 |