| Red | Green | Blue | |
| z | 17.64 | ||
| znorm | Inf | ||
| sky | -Inf | -NaN | -Inf |
| S/N | 14.5 | 25.7 | 28.1 |
| S/N(c) | 14.5 | 25.7 | 28.1 |
| SN(E/C) |
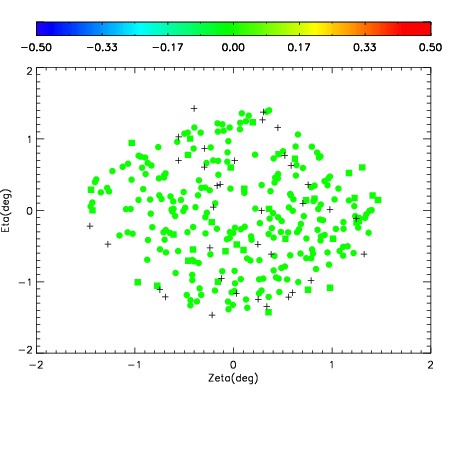
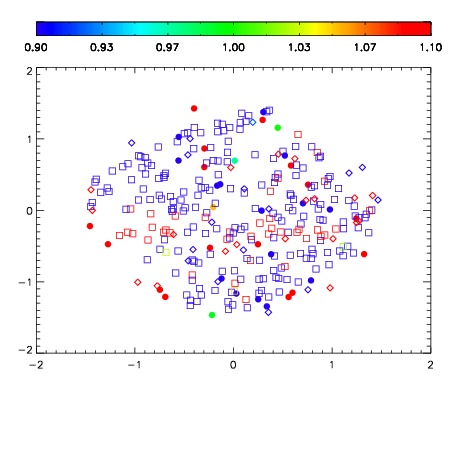
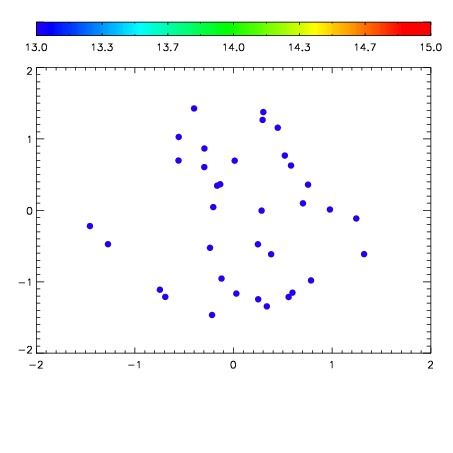

| Frame | Nreads | Zeropoints | Mag plots | Spatial mag deviation | Spatial sky 16325A emission deviations (filled: sky, open: star) | Spatial sky continuum emission | Spatial sky telluric CO2 absorption deviations (filled: H < 10) | |||||||||||||||||||||||
| 0 | 0 |
|
|
|
|
|
|
| IPAIR | NAME | SHIFT | NEWSHIFT | S/N | NAME | SHIFT | NEWSHIFT | S/N |
| 0 | 03090013 | 0.493429 | 0.00000 | 82.2108 | 03090012 | -0.00359787 | 0.497027 | 86.2207 |
| 1 | 03090010 | 0.491491 | 0.00193802 | 127.031 | 03090015 | -0.00368193 | 0.497111 | 140.881 |
| 2 | 03090009 | 0.492621 | 0.000808001 | 121.199 | 03090008 | 0.00000 | 0.493429 | 114.533 |
| 3 | 03090014 | 0.491576 | 0.00185302 | 117.549 | 03090011 | -0.00144154 | 0.494871 | 113.082 |