| Red | Green | Blue | |
| z | 17.64 | ||
| znorm | Inf | ||
| sky | -NaN | -NaN | -Inf |
| S/N | 26.3 | 42.4 | 47.9 |
| S/N(c) | 26.3 | 42.4 | 47.9 |
| SN(E/C) |
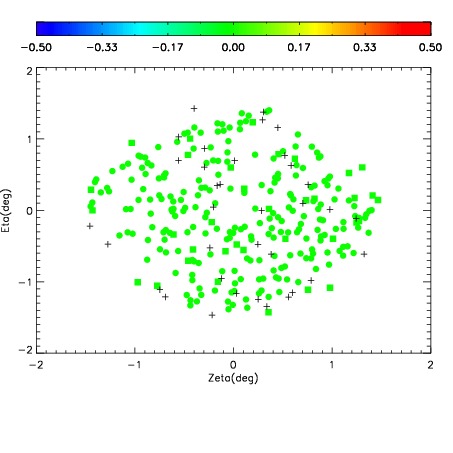
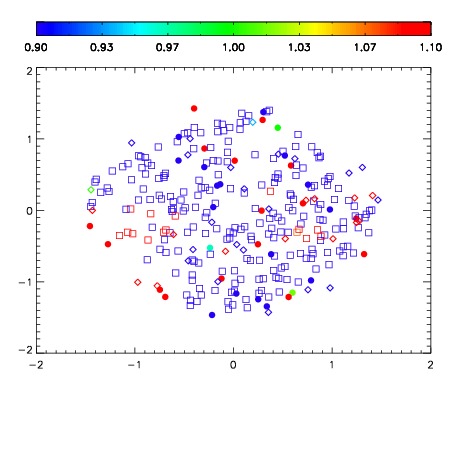
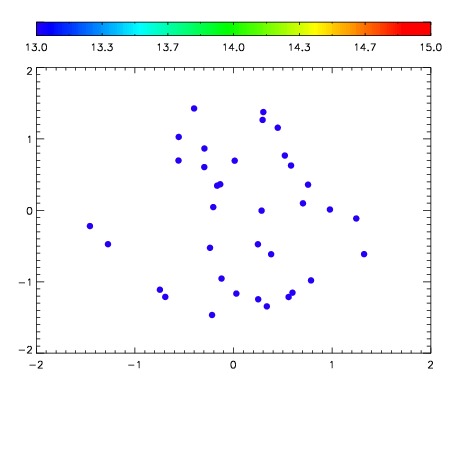

| Frame | Nreads | Zeropoints | Mag plots | Spatial mag deviation | Spatial sky 16325A emission deviations (filled: sky, open: star) | Spatial sky continuum emission | Spatial sky telluric CO2 absorption deviations (filled: H < 10) | |||||||||||||||||||||||
| 0 | 0 |
|
|
|
|
|
|
| IPAIR | NAME | SHIFT | NEWSHIFT | S/N | NAME | SHIFT | NEWSHIFT | S/N |
| 0 | 03100020 | 0.486987 | 0.00000 | 174.798 | 03100017 | 0.00565003 | 0.481337 | 166.473 |
| 1 | 03100016 | 0.482059 | 0.00492799 | 184.777 | 03100021 | 0.000936667 | 0.486050 | 188.815 |
| 2 | 03100015 | 0.482403 | 0.00458398 | 179.953 | 03100014 | 0.00000 | 0.486987 | 184.983 |
| 3 | 03100019 | 0.486386 | 0.000600994 | 176.314 | 03100018 | 0.00301700 | 0.483970 | 171.547 |